

TLDR
- Aster (ASTER) dropped 4% after DeFiLlama removed the platform on October 5 due to concerns about inflated trading volume data that mirrored Binance perpetuals.
- Large holders are exiting: whale wallets reduced ASTER by 12% and smart money investors cut positions by 37% since the delisting announcement.
- ASTER trades between $1.86-$2.03, testing triangle pattern support at $1.77 with resistance at the $1.92 moving average.
- Bullish breakout above $2.15 could push ASTER toward $2.88 (56% gain), while losing $1.77 support may trigger decline to $1.50 or lower.
- Technical indicators show neutral RSI at 45-50, with analysts warning of liquidity vacuum below $1.50 that could accelerate selling.
Aster price action has turned bearish after the token lost a major listing. The altcoin now faces a critical technical test as large investors reduce their holdings.
DeFiLlama founder 0xngmi announced on October 5 that Aster would be delisted from the analytics platform. The removal followed concerns that Aster’s reported trading volumes matched Binance’s perpetuals market data. This raised questions about whether the exchange’s growth was genuine or artificially inflated.
The delisting has triggered selling from major holders. According to Nansen data, whale wallets holding over $1 million in ASTER have cut their positions by 12% since Sunday. Smart money investors have reduced exposure even more drastically, dumping 37% of their holdings.
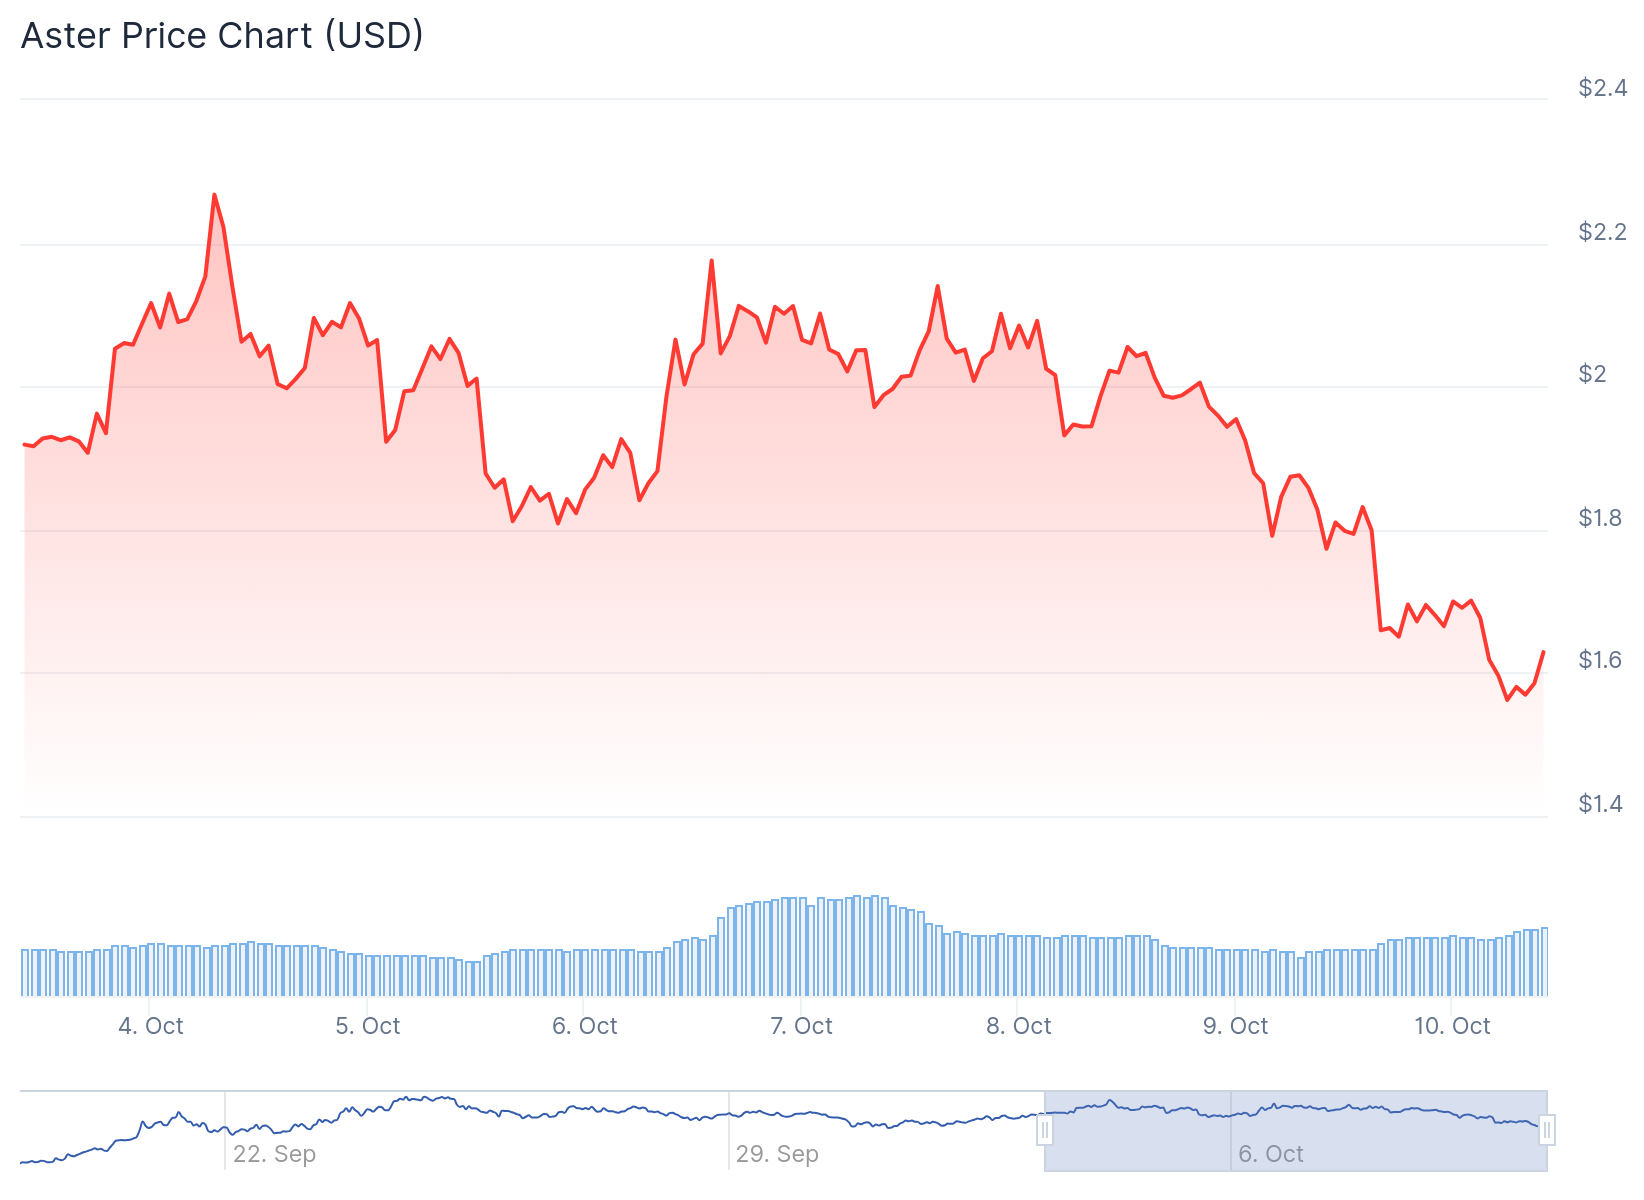
ASTER currently trades around $1.86 to $2.03, representing a 4% decline. The token is testing support within a triangle pattern that has formed on the 4-hour chart.
Triangle Pattern Shows Two Possible Outcomes
The technical setup shows ASTER testing its ascending support line near $1.77. Buyers have defended this level so far, but pressure is building. The 50-period moving average at $1.92 acts as immediate resistance above current prices.
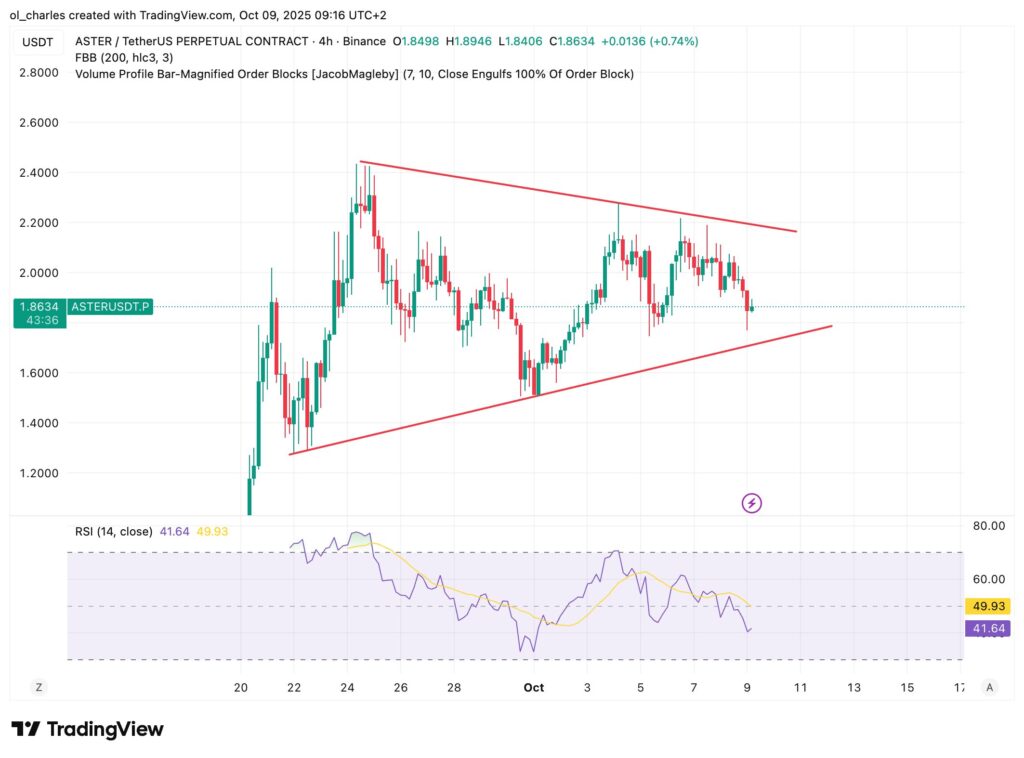
If ASTER holds support and breaks above the moving average, bulls could target the upper triangle resistance around $2.10-$2.15. A confirmed breakout from this pattern points to a measured target of $2.88, which would represent a 56% gain from current levels.

The bearish scenario involves losing the $1.77 support with strong volume. This would invalidate the bullish pattern and open the door to $1.50-$1.55. Technical analysis reveals a liquidity vacuum below $1.50, meaning selling could accelerate rapidly if that level breaks.
Volume will determine which direction ASTER breaks. Analysts say a valid bullish breakout needs volume at least 50% above recent averages. Without strong buying pressure, the triangle could resolve to the downside.
On-Chain Data Points to Weakening Demand
The reduction in whale and smart money holdings signals declining confidence in ASTER. Smart money refers to experienced investors and institutions whose moves often predict market trends. Their 37% position reduction suggests major players expect further downside.
The Relative Strength Index sits in neutral territory between 45-50. This leaves room for movement in either direction before reaching extreme conditions. However, a correction into oversold territory on the 4-hour chart remains likely if selling continues.
ASTER’s price action correlates with broader crypto market conditions. Bitcoin recently reached a new all-time high of $126,000 in early October before pulling back to $122,000. Ethereum trades near $4,450 as the market enters a consolidation phase.
A recovery in major cryptocurrencies would support ASTER’s bullish case. Conversely, continued weakness in Bitcoin and Ethereum would likely pressure altcoins further. The overall market structure remains crucial for ASTER’s near-term direction.
At press time, ASTER trades at $2.03. The coming days will determine whether buyers can defend support or if the token will test lower levels. The $1.77 support represents a line in the sand for ASTER’s short-term outlook.
Get 3 Free Stock Ebooks
Discover top-performing stocks in AI, Crypto, and Technology with expert analysis.
- Top 10 AI Stocks - Leading AI companies
- Top 10 Crypto Stocks - Blockchain leaders
- Top 10 Tech Stocks - Tech giants

