

TLDR
- Aster (ASTER) fell 15% on Wednesday, recording the largest loss among top 100 cryptocurrencies
- Prominent traders like TraderSZ opened long positions with price targets at $2.50, $3.00, and $3.50
- Binance futures data reveals elite traders maintain a 2.80 long/short ratio favoring bullish positions
- Whales sold approximately 8 million ASTER tokens valued at $12 million during the past week
- Technical indicators suggest the token completed an ABC correction at the 0.618 Fibonacci retracement level
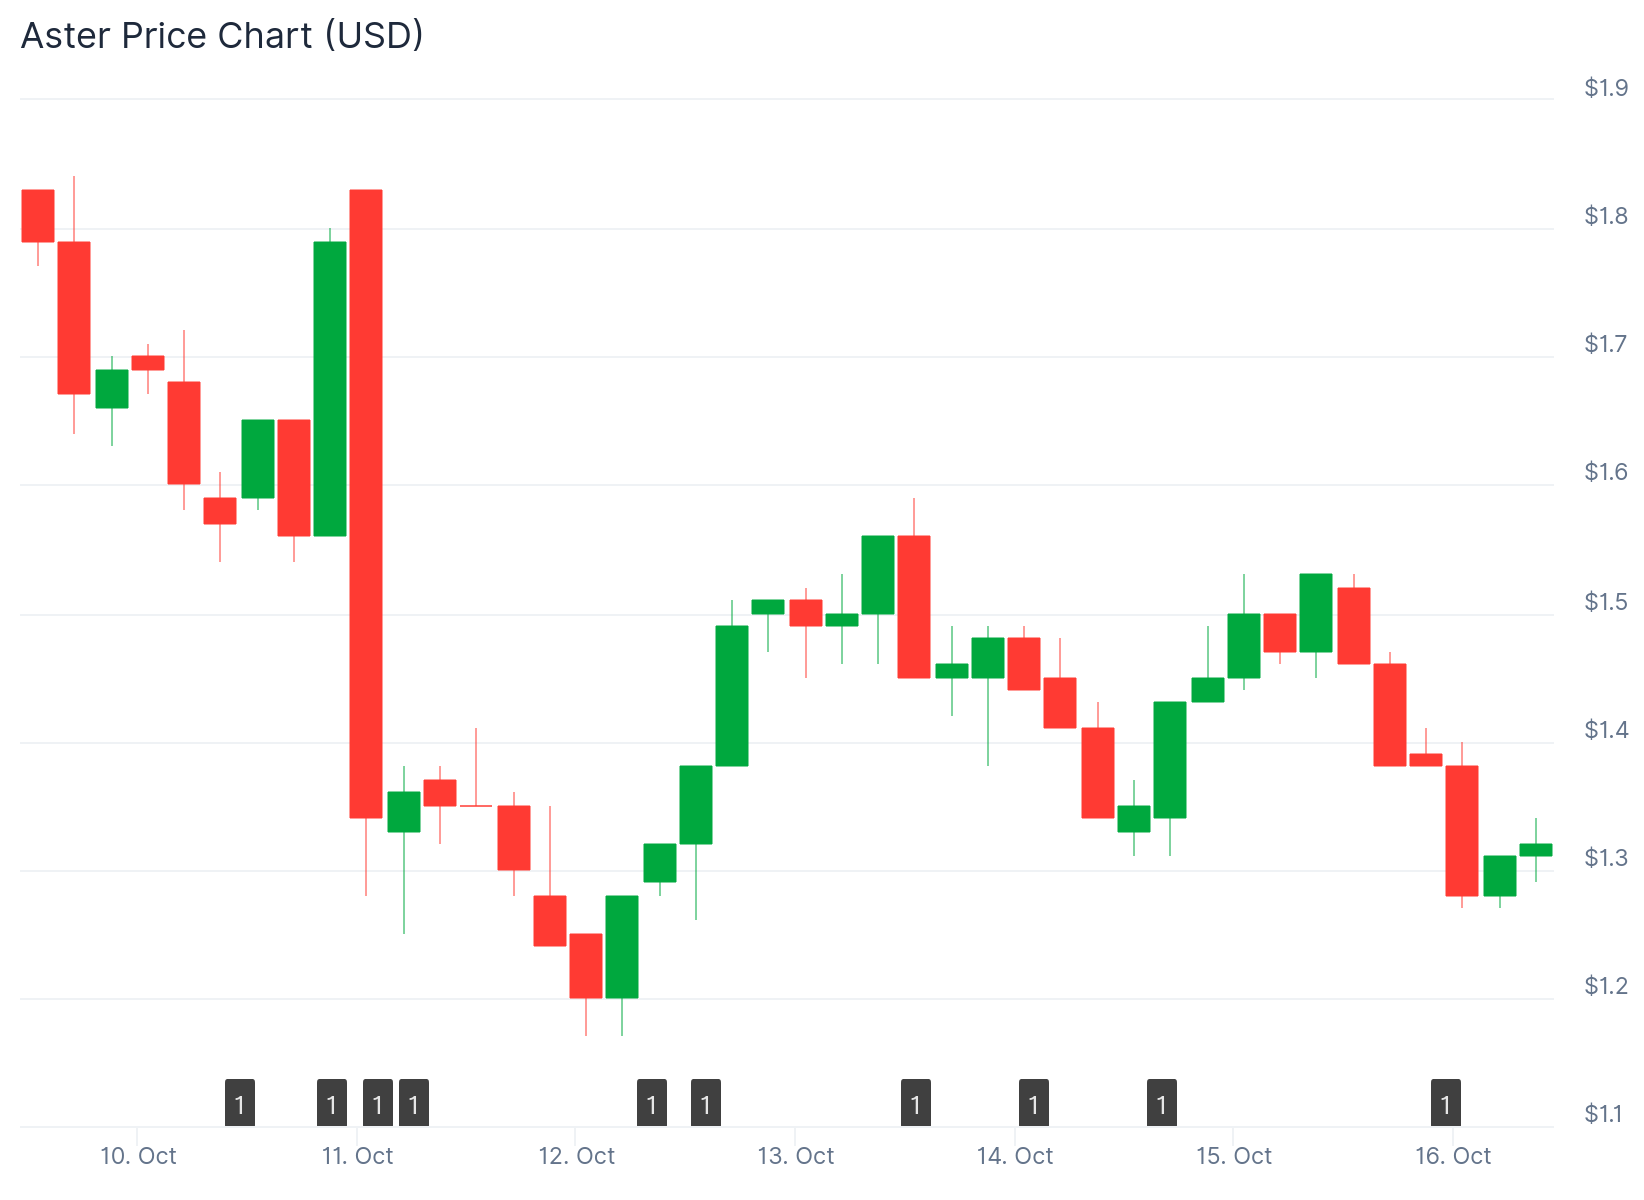
Aster experienced a steep decline on Wednesday, falling nearly 15% in 24 hours. This drop made ASTER the worst-performing cryptocurrency among the top 100 assets on CoinMarketCap.
The broader digital asset market also traded lower. However, several high-profile traders are now positioning for a rebound.
TraderSZ, a prominent cryptocurrency trader, announced opening a swing long position. His price targets include $2.50, $3.00, and $3.50 on the upside.
He placed a stop-loss order at $0.99 to limit potential losses. Trader Yazan also reversed his position by closing a short trade and opening a leveraged long.
Onchain Lens identified a substantial $7.65 million spot purchase on Binance. This large order suggests institutional buyers are accumulating during the price weakness.
Elite Traders Show Bullish Conviction
Data from Coinglass reveals interesting positioning among professional market participants. The Top Trader Long/Short ratio on Binance for ASTER/USDT currently sits at 2.80.

This metric indicates that elite traders hold nearly three times more long positions compared to short positions. The data reflects strong bullish sentiment among experienced accounts.
Trader Bluntz provided technical analysis supporting the bullish case. He noted that ASTER completed a clean ABC correction pattern.
The price reached the 0.618 Fibonacci retracement level perfectly. According to Elliott Wave theory, ABC corrections signal the end of pullbacks within larger uptrends.
The C wave typically concludes near the 0.618 Fibonacci level where buyers re-enter. Bluntz interprets the recent decline as a textbook correction rather than a trend change.
The 4-hour chart displays an M-shaped formation. This structure could evolve into a double bottom pattern, which typically signals bullish reversals.
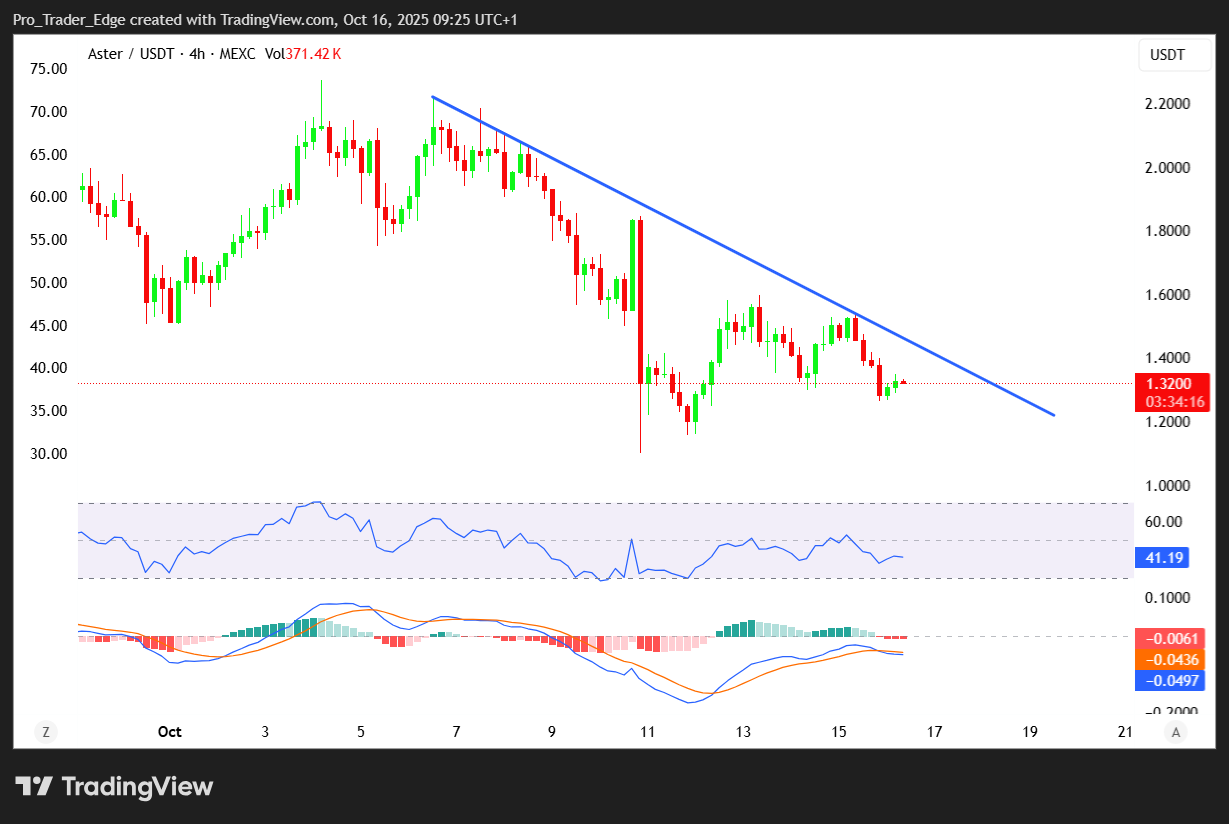
A successful retest of the $1.15 support zone would confirm the double bottom setup. A breakout above $1.32 resistance would provide additional bullish confirmation.
Whales Reduce Holdings Despite Trader Optimism
While professional traders open long positions, whale activity presents a contrasting picture. Large holders possessing over 10 million ASTER sold nearly 20% of their positions last week.
These sales totaled approximately 8.05 million tokens worth $12.07 million. Smart money addresses reduced their holdings by roughly 5% during the same period.
Exchange balances grew by 12.32 million tokens over the past day. Increasing exchange reserves typically signal sellers preparing to liquidate positions.
The Money Flow Index shows declining momentum with lower lows. This pattern suggests retail traders have not started buying the decline yet.
ASTER currently trades within a descending triangle formation on shorter timeframes. The token needs to close above $1.59 to negate the bearish technical setup.
Breaking this resistance could open pathways toward $1.72 and $2.02. The Relative Strength Index displays a hidden bearish divergence pattern where momentum weakens despite price stability.
Support levels sit at $1.30, $1.15, and $0.98. These zones represent critical areas where buyers may defend the price.
Professional traders appear confident about an upward reversal. Exchange data confirms their positioning despite recent whale selling activity and the current price decline.
Get 3 Free Stock Ebooks
Discover top-performing stocks in AI, Crypto, and Technology with expert analysis.
- Top 10 AI Stocks - Leading AI companies
- Top 10 Crypto Stocks - Blockchain leaders
- Top 10 Tech Stocks - Tech giants

