
 Price: Golden Cross Pattern Emerges as Bulls Fight to Hold $110,000")
TLDR
- Bitcoin is retesting the golden cross technical pattern at $110,000, which previously led to gains exceeding 1,000% in past cycles
- The 4-hour Money Flow Index indicates oversold conditions, pointing to a possible short-term price bounce
- Crypto analysts warn that Bitcoin must maintain support above $110,000 to keep the current bull cycle alive
- Recent market volatility followed Trump’s announcement of 100% tariffs on Chinese imports starting November 1
- Bitcoin faces immediate resistance at $116,000 after recovering from a brief drop below $110,000
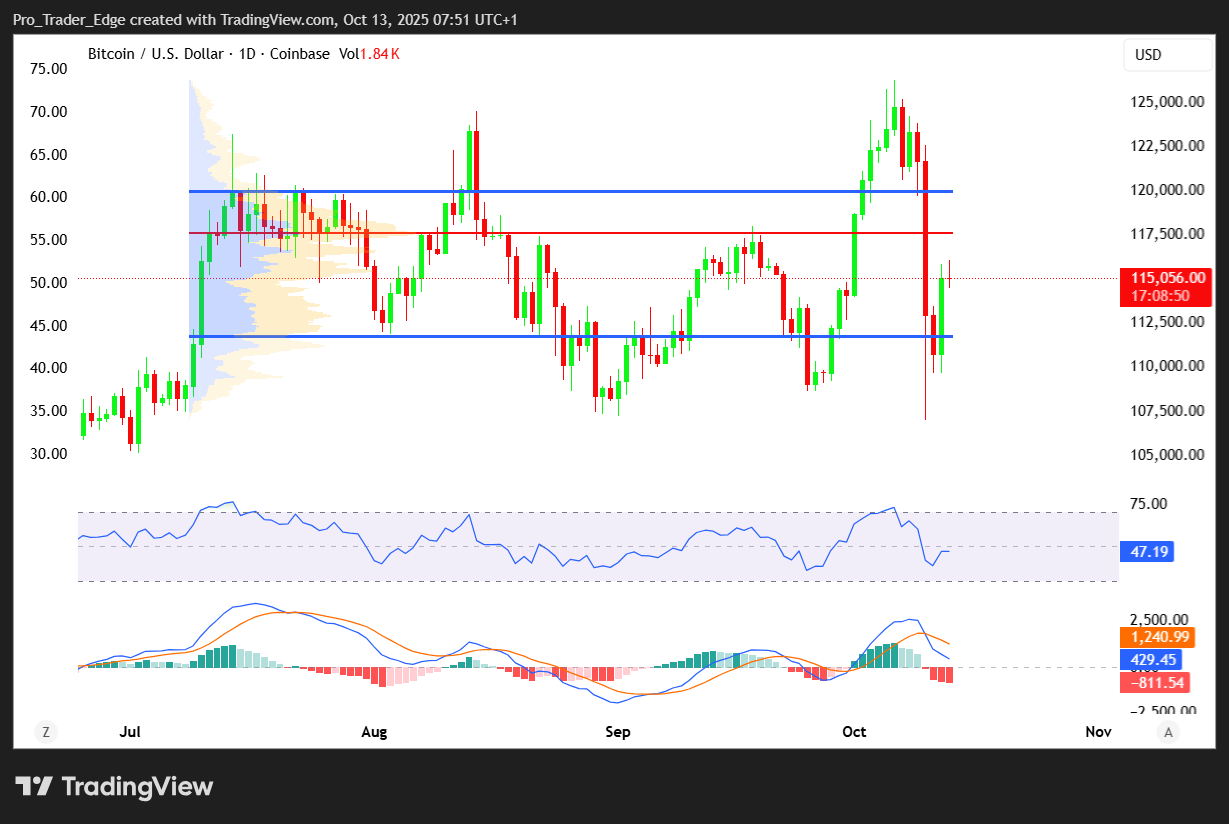
Bitcoin is currently retesting a bullish technical formation known as the golden cross. This pattern forms when the 50-day moving average crosses above the 200-day moving average.
Crypto analyst Mister Crypto shared data showing Bitcoin’s previous golden crosses produced extraordinary returns. The 2017 golden cross led to a 2,200% price increase. The 2020 pattern resulted in a 1,190% gain.
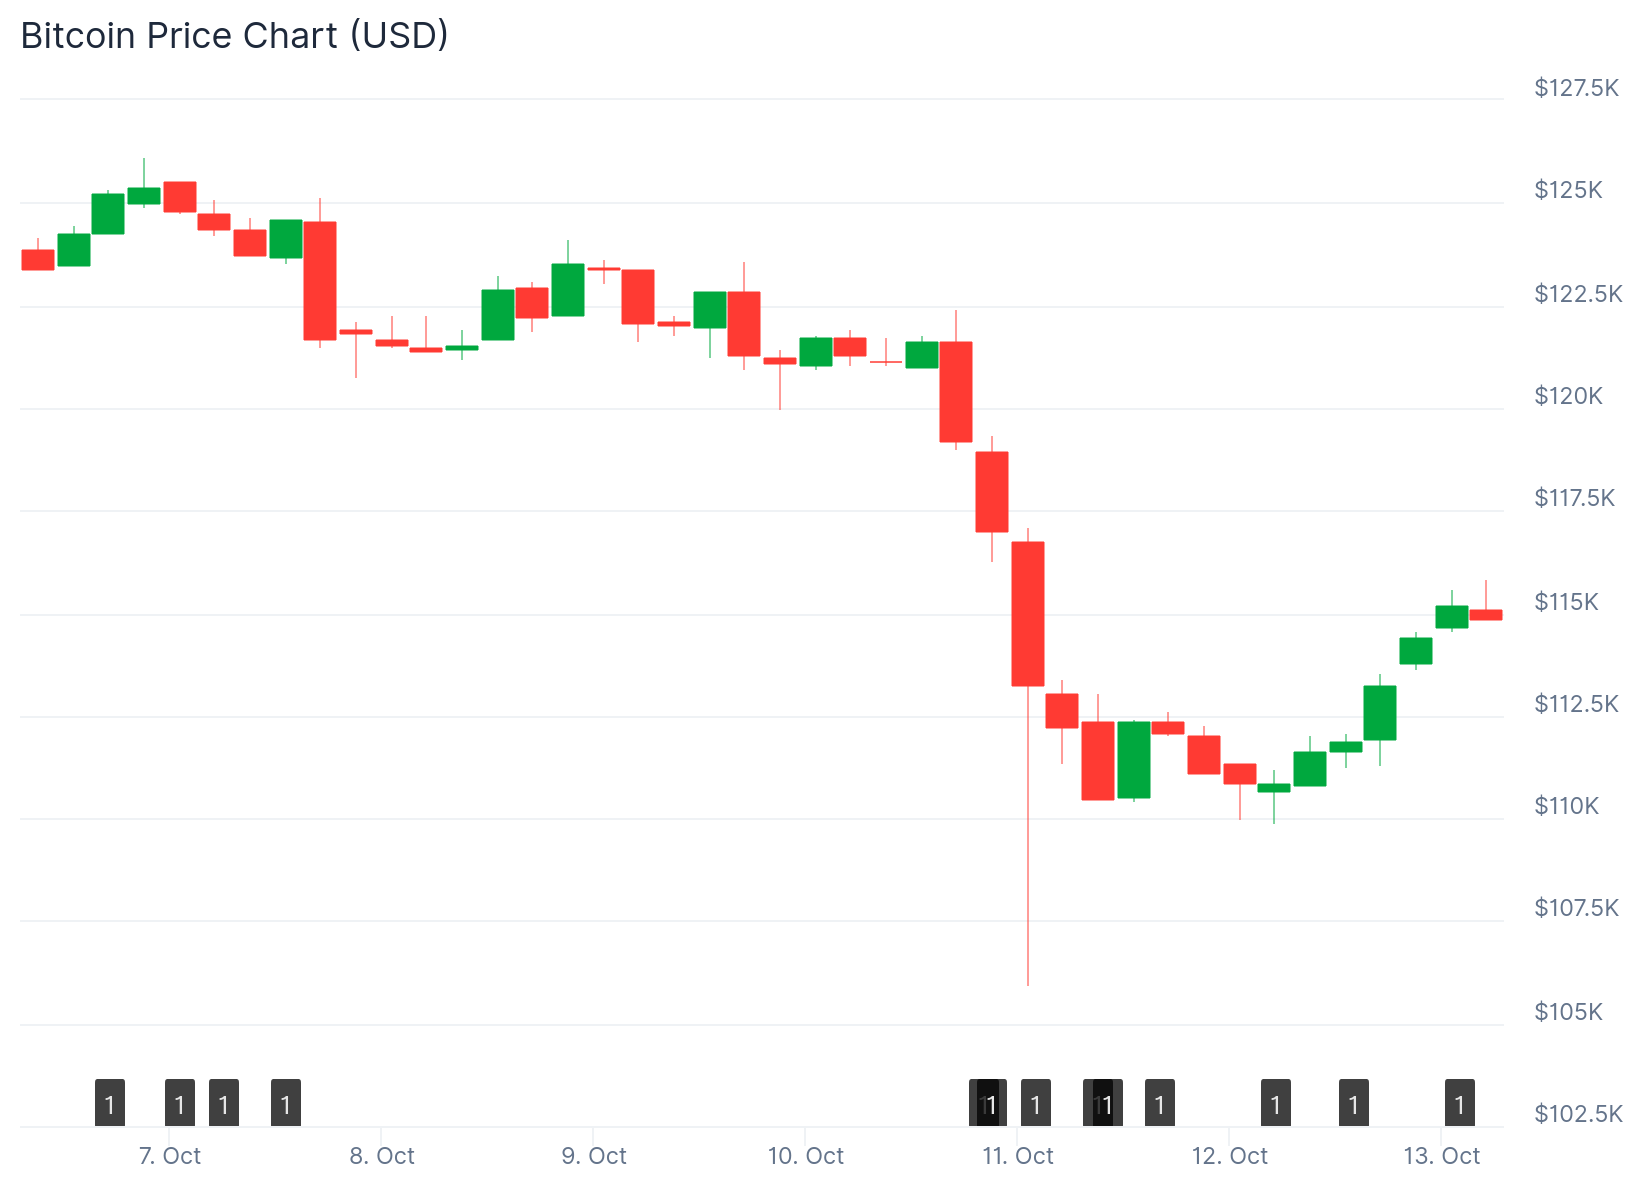
Bitcoin is trading near $110,000. Analysts say holding this level is critical for the continuation of the current market cycle. A confirmed breakout could push prices higher in the coming weeks.
The technical setup appears favorable for bulls. However, several resistance levels stand in the way of further gains.
Critical Support Level at $110,000
Crypto analyst Mac warned that Bitcoin must defend the $110,000 level. Losing this support could signal the end of the current bull cycle.
Mac noted that the 4-hour Money Flow Index shows deeply oversold conditions. This technical indicator suggests Bitcoin may be due for a short-term bounce. He expects modest upward movement next week rather than a major surge.

The risk-to-reward ratio currently favors buyers. However, caution remains warranted given recent market volatility.
Bitcoin recently recovered after briefly dropping below $110,000. The price climbed back above $113,500 following this dip. The recovery demonstrates buyer interest at lower levels.
Resistance Levels and Recovery Path
Bitcoin now faces multiple resistance zones. The price is trading below $116,000 and the 100-hour simple moving average. A bearish trend line is forming with resistance at $119,500.
The immediate resistance sits at $116,000. The first key resistance level is $116,250. Breaking above $118,000 would open the path to test $119,500.
A successful break above the trend line could push Bitcoin toward $120,000. The next major barrier for bulls would be $122,500.
If Bitcoin fails to clear $116,000, another decline could occur. The first major support is at $113,500. Additional support levels exist at $112,500 and $110,500.
Market Volatility and External Pressures
Recent market turbulence affected both traditional markets and cryptocurrencies. Fundstrat co-founder Tom Lee observed that markets had risen 36% since April before Friday’s sharp decline.
The VIX volatility index spiked 1.29%, marking the 51st largest increase ever recorded. Lee suggested this type of volatility spike often indicates a short-term market bottom. Traders typically rush to hedge positions rather than sell during these events.
President Trump announced 100% tariffs on all Chinese imports beginning November 1. This decision came in response to China’s new export restrictions on rare earth minerals.
China controls approximately 70% of global rare earth supply. New Chinese regulations require export licenses for products containing more than 0.1% Chinese-sourced rare earths. These rules take effect December 1.
The tariff announcement contributed to the recent market sell-off. However, some analysts believe the pullback may have been overdue given the strong gains since April.
Bitcoin’s technical indicators show mixed signals. The hourly MACD is gaining momentum in the bullish zone. The RSI is trading above the 50 level, suggesting neutral to slightly bullish conditions.
Get 3 Free Stock Ebooks
Discover top-performing stocks in AI, Crypto, and Technology with expert analysis.
- Top 10 AI Stocks - Leading AI companies
- Top 10 Crypto Stocks - Blockchain leaders
- Top 10 Tech Stocks - Tech giants

