
 Price Prediction: Bulls Eye $119K Target as On-Chain Data Shows Recovery Signs")
TLDR
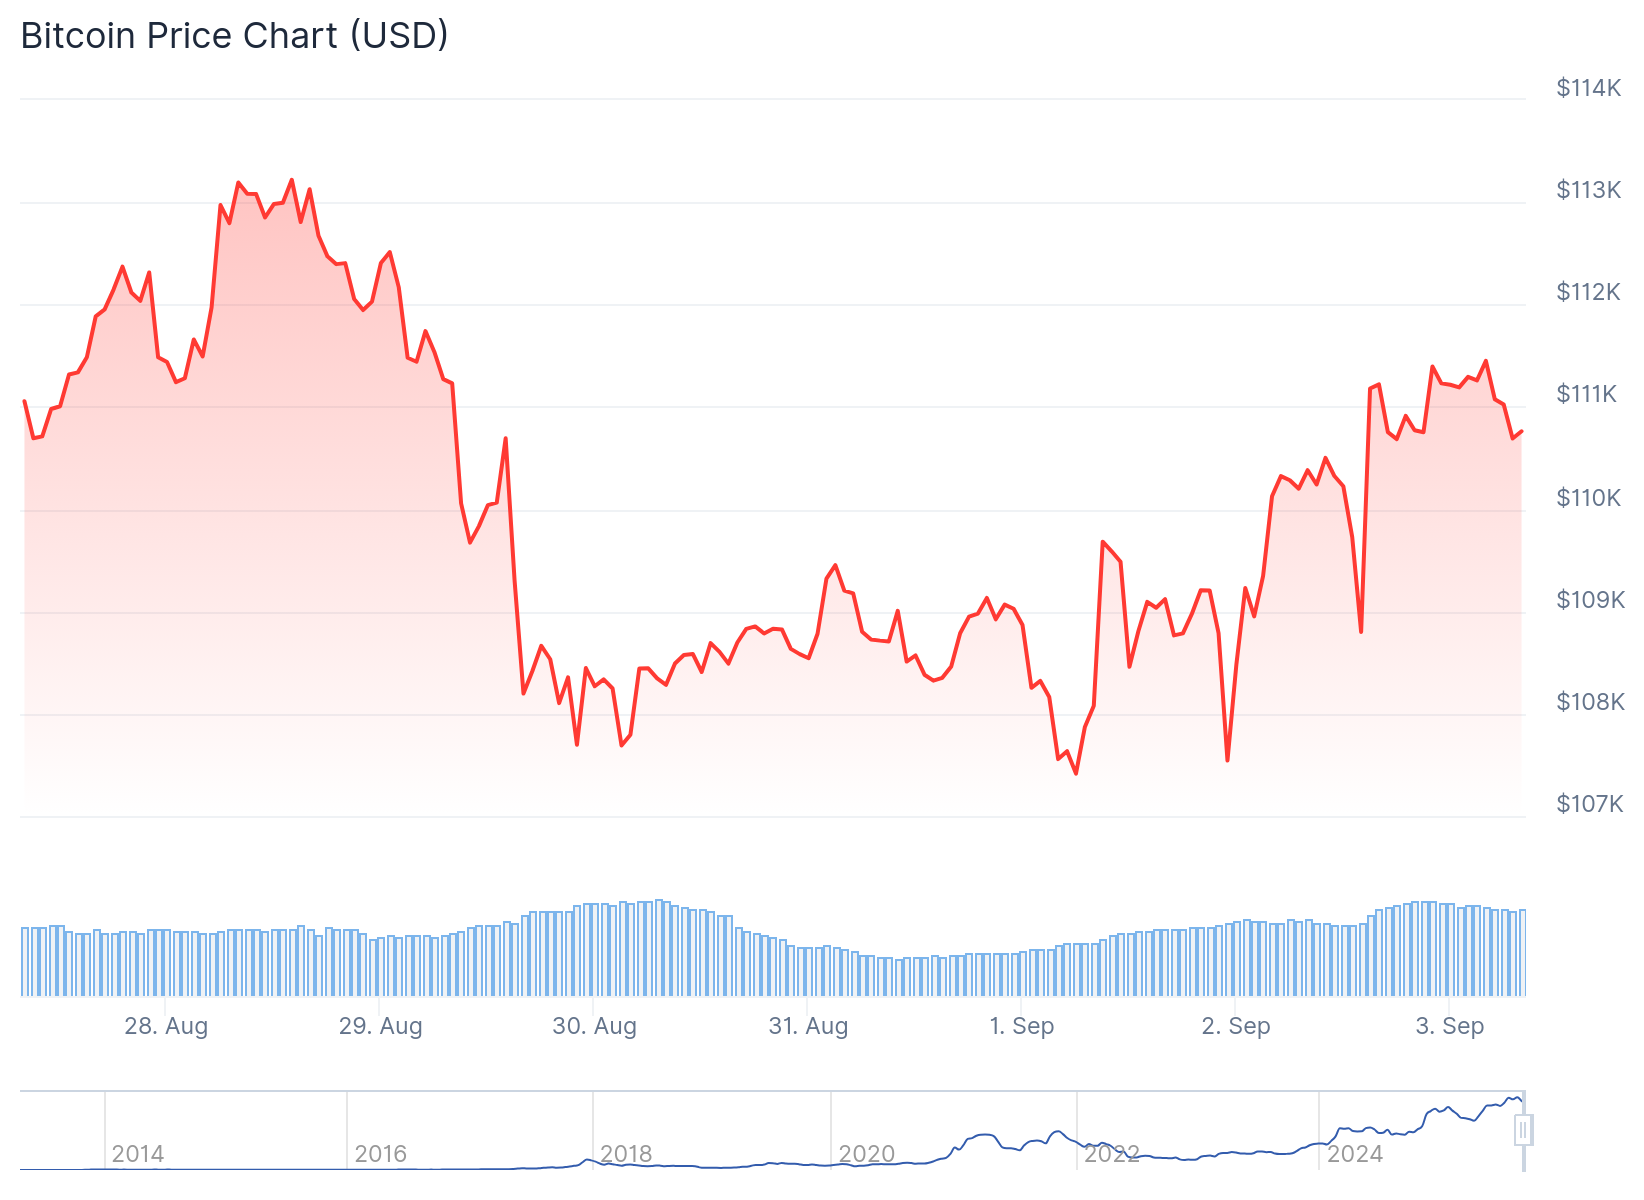
- Bitcoin price rebounds 3% to $110,000 after testing $107,300 support level
- On-chain metrics show strong buyer accumulation contrasting with Ethereum weakness
- Exchange flows from Coinbase and Binance suggest potential liquidity regime shift
- Options traders position for September breakout with $120K-$140K strike buildups
- Key resistance at $113,650 must break to confirm bullish trend toward $119,500
Bitcoin price has recovered 3% over the past two days, reaching approximately $110,000 after testing crucial support at $107,300 on Monday. The rebound coincides with improving on-chain metrics and shifting exchange flow patterns.
Glassnode data reveals Bitcoin’s Cost Basis Distribution shows dense accumulation activity. This on-chain metric tracks price levels where large supply volumes have been accumulated or distributed. Bitcoin’s spot activity appears much stronger than Ethereum’s sparse flows.

The clustering of transactions across recent price levels indicates strong buyer conviction. This type of spot-driven activity has historically provided more sustainable support than futures market momentum alone.
Exchange Flow Data Supports Recovery
CryptoQuant analysis highlights significant exchange flow changes. Coinbase recorded consistent netflow spikes between August 25-31, occurring right after its 30-day moving average reached the lowest point since early 2023.
Binance simultaneously saw its 30-day moving average netflow hit the highest level since July 2024. This pattern historically aligns with reaccumulation phases before new local price peaks.
The simultaneous Coinbase trough and Binance peak suggests meaningful reserve redistribution among exchanges. This redistribution could establish foundation for upward price movement.

Long-term holder spending has increased recently, with the 14-day moving average trending higher. However, this activity remains within normal cycle parameters and well below October-November 2024 peaks.
Technical Analysis Points to Key Levels
Bitcoin broke above Monday’s $109,900 high during Tuesday’s New York trading session. Lower timeframe charts including 15-minute and one-hour intervals now show bullish structure breaks.
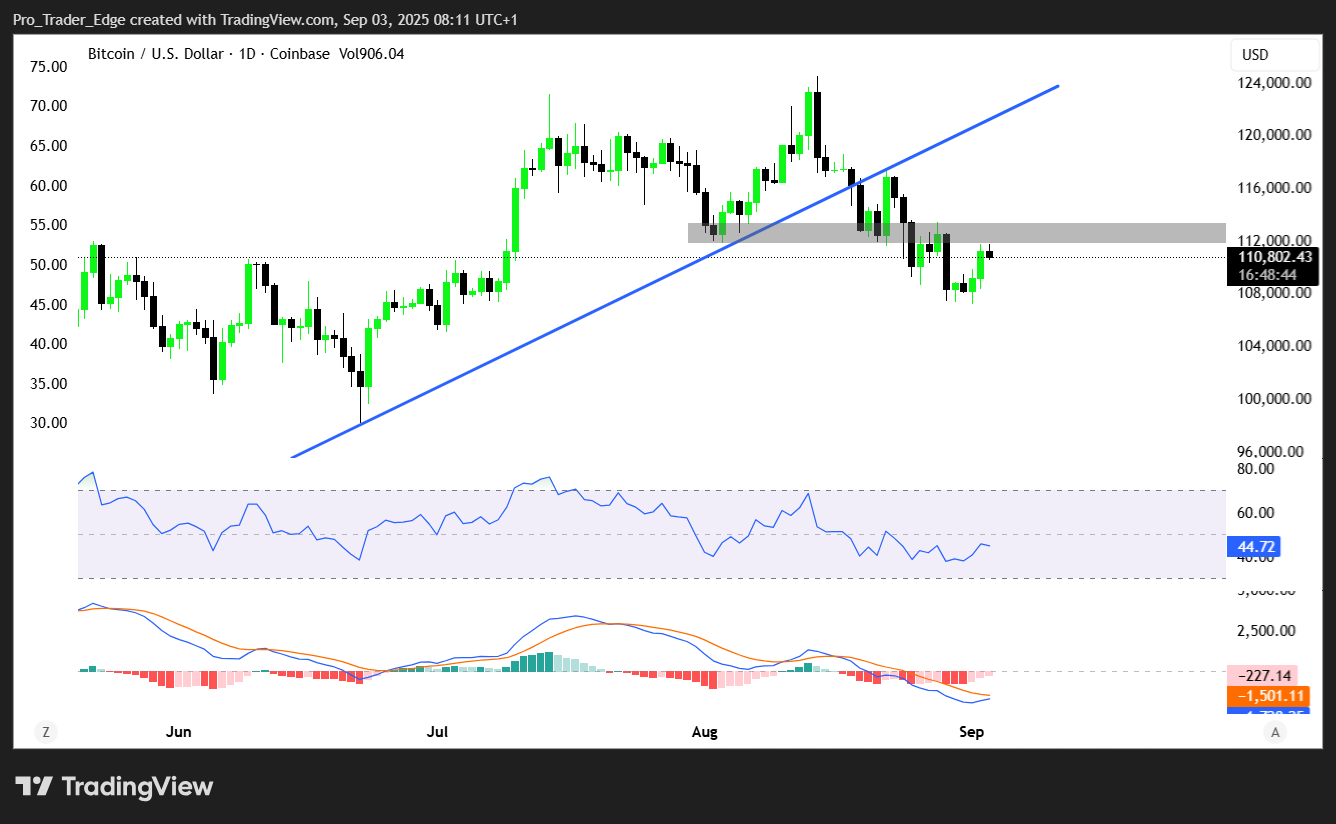
The four-hour relative strength index has reclaimed levels above 50, reinforcing growing bullish sentiment. For continued recovery, Bitcoin must clear resistance between $112,500 and $113,650.
A decisive close above $113,650 would confirm bullish structure break on daily charts. This would also invalidate the descending trendline that has capped price action for two weeks.
Successful breakout could open pathways toward liquidity targets at $116,300, $117,500, and potentially $119,500.
Options Market Activity
Bitcoin options traders are positioning for late September gains. Open interest has accumulated at $120,000, $130,000, and $140,000 strike prices for September 26 expiry.
Perpetual contract open interest increased 2.35% to $30 billion over two days. Traders are positioning ahead of Friday’s employment data release.
The one-week 25 delta skew jumped from 6.75 to 12 overnight, showing increased demand for downside protection despite bullish positioning.
Bitcoin Price Prediction
Current technical setup suggests Bitcoin could target $119,500 if it breaks above $113,650 resistance. However, failure to break this level leaves downside risk toward $100,000-$105,000 support zone.
September’s historically bearish seasonality remains a factor. Friday’s Non-farm Payrolls data and Federal Reserve rate cut expectations will likely determine near-term direction.
Get 3 Free Stock Ebooks
Discover top-performing stocks in AI, Crypto, and Technology with expert analysis.
- Top 10 AI Stocks - Leading AI companies
- Top 10 Crypto Stocks - Blockchain leaders
- Top 10 Tech Stocks - Tech giants

