
 Price Prediction: Could Bollinger Band Squeeze Trigger $150K Rally?")
TLDR
- Bitcoin forms ascending triangle pattern with breakout potential targeting $123K-$150K range
- Monthly Bollinger Bands reach extreme compression levels not seen since 2009
- Cup-and-handle formation projects $305K target for 2025-2026 timeline
- Trump pushes for 100 basis point Fed rate cut while Metaplanet commits $1.4B to BTC
- ETF inflows turn positive as institutional demand returns to Bitcoin market
Bitcoin price currently sits at $112,236 as multiple technical signals converge to suggest a major price movement ahead. The world’s largest cryptocurrency trades within a well-defined ascending symmetrical triangle formation.
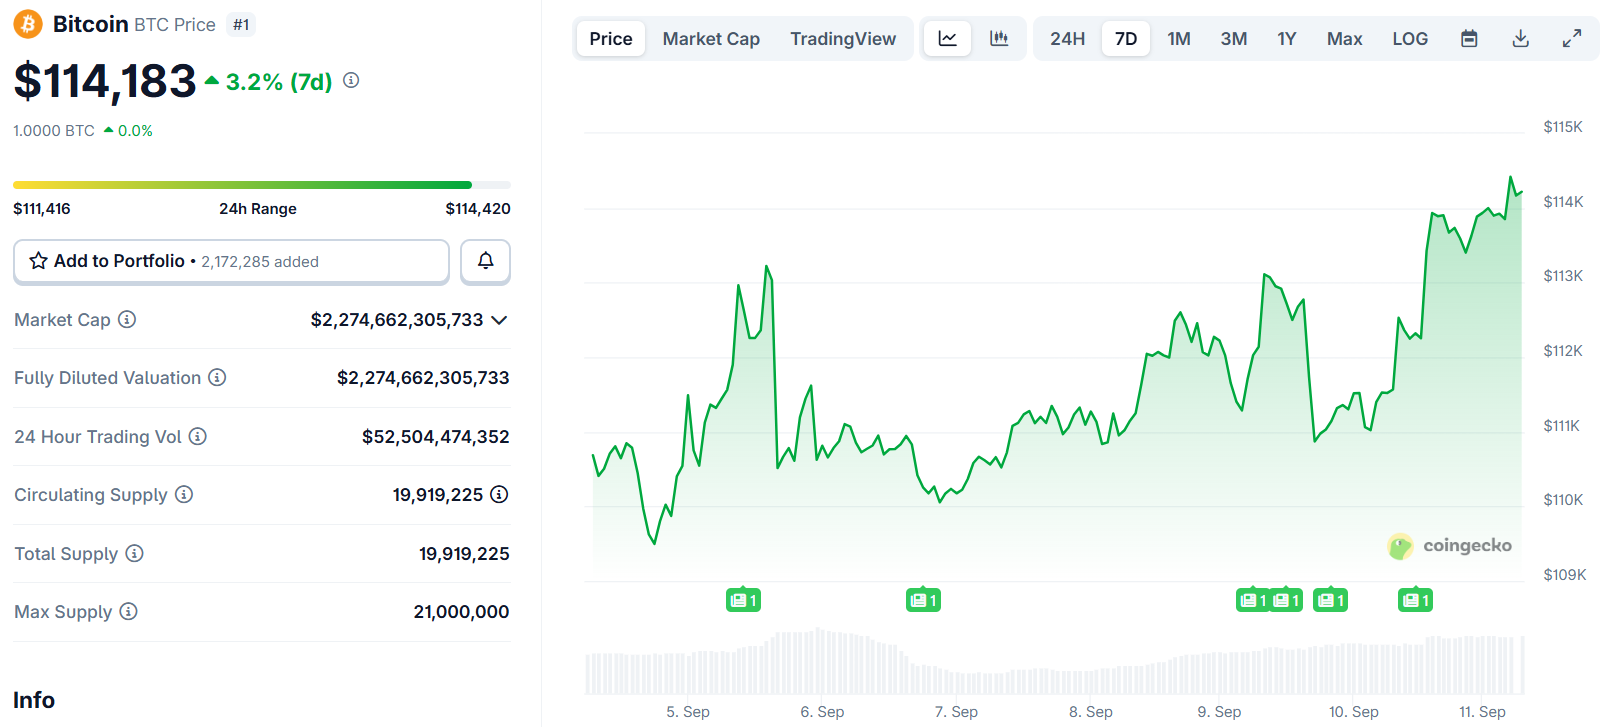
Support holds firm near $107,304 while resistance awaits at $117,156, marked by the 0.618 Fibonacci retracement level. A decisive break above this zone could propel Bitcoin toward the $123,731 target.
The technical setup extends further with the 1.618 Fibonacci extension at $133,882 serving as the next major resistance level. Long-term projections point to $150,309 at the 2.618 extension as a potential peak target.
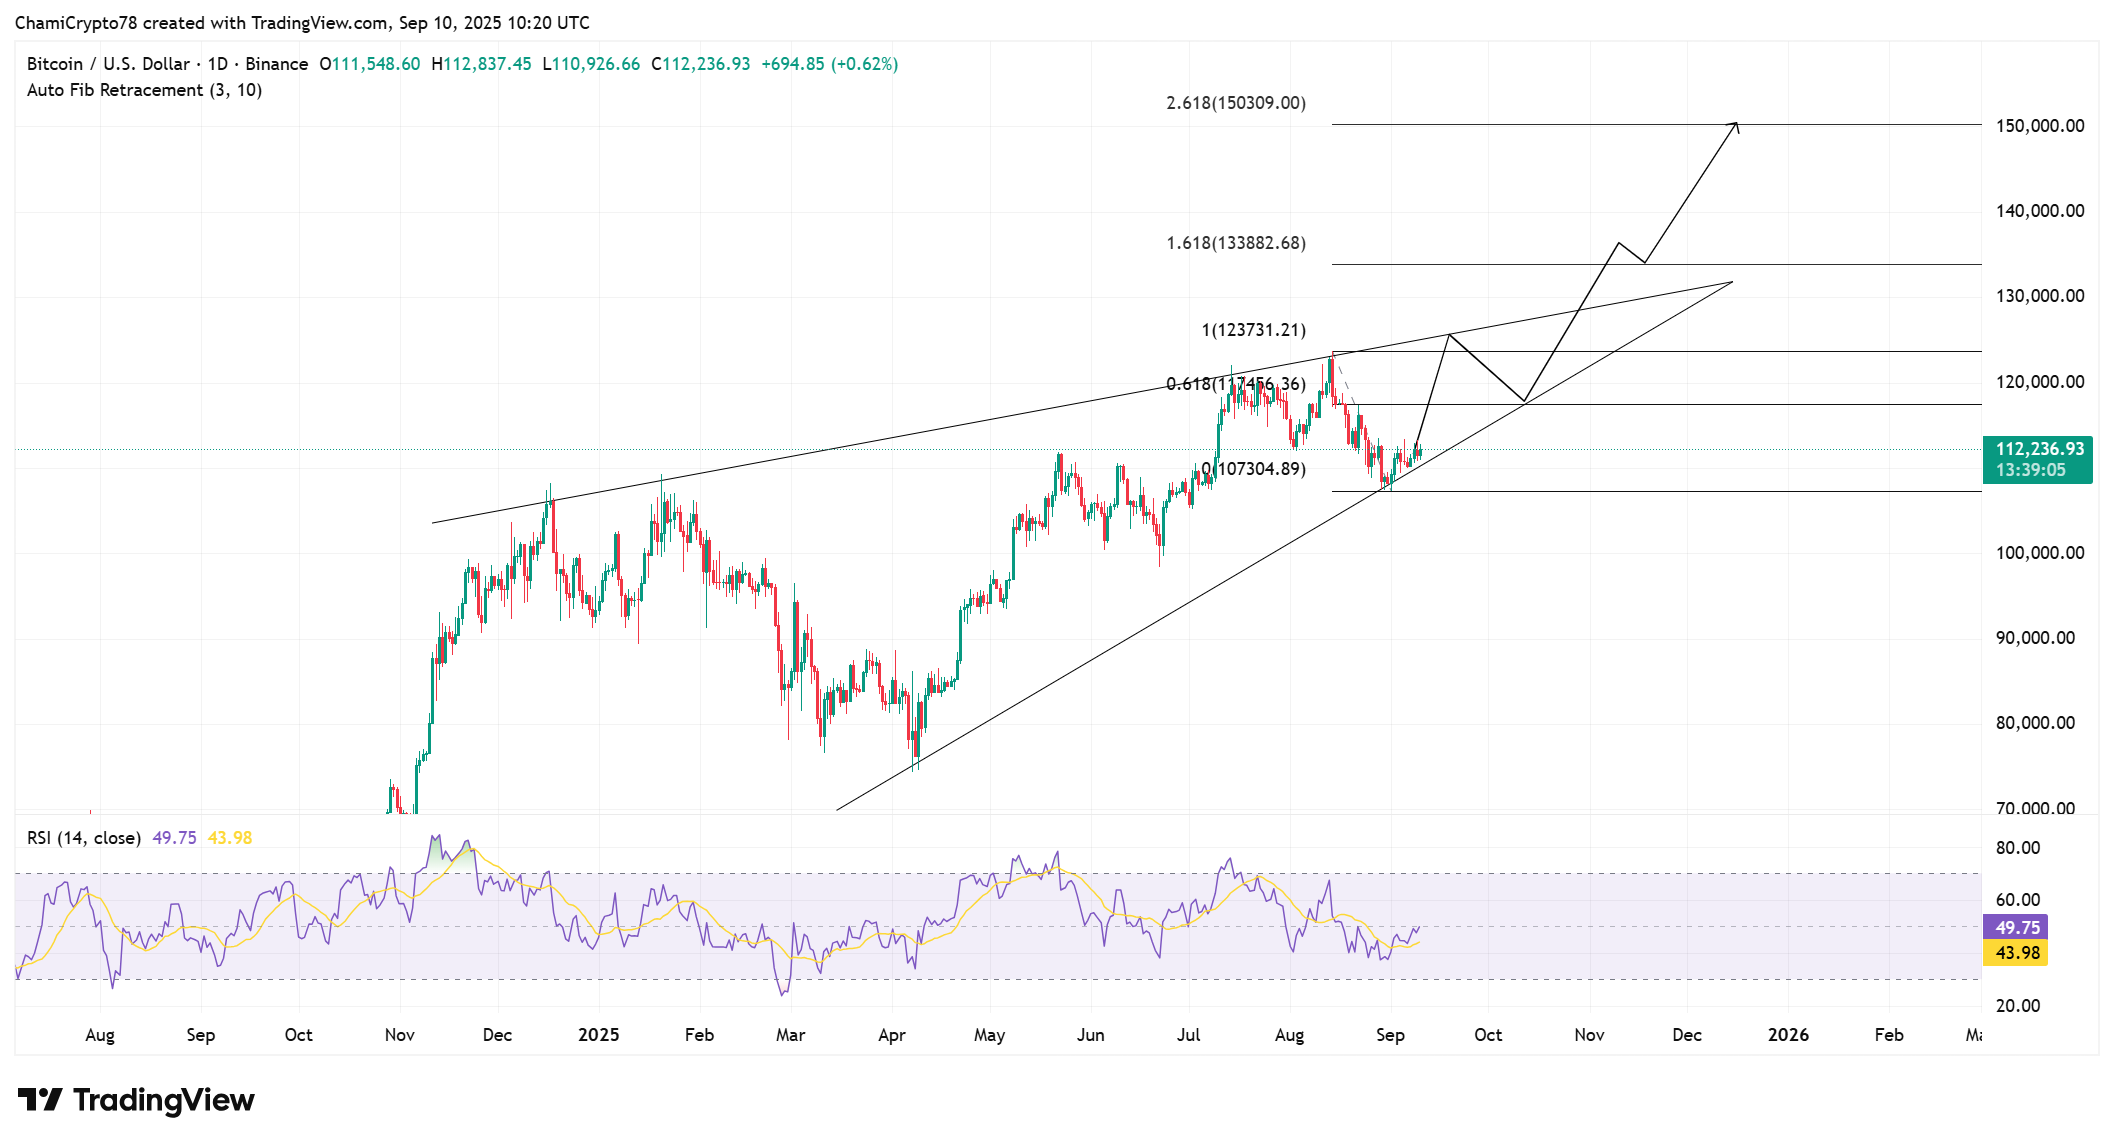
Current RSI readings at 49.75 remain above the signal line at 43.98, providing bullish momentum confirmation. This aligns with the overall triangle structure suggesting upward pressure continues building.
Bollinger Bands Signal Historic Volatility
Bitcoin’s monthly Bollinger Bands have reached their most compressed state since the cryptocurrency’s launch in January 2009. This technical indicator measures price volatility and momentum within specific ranges.
Historical data shows similar compressions in 2012, 2016, and 2020 all preceded explosive price rallies. The current setup appears even tighter than previous cycles, suggesting potential for Bitcoin’s largest price movement on record.

Technical analyst Matthew Hyland first identified this extreme compression pattern. Multiple other analysts have confirmed the setup, with many expecting heavy volatility to the upside in Q4.
The monthly timeframe compression typically leads to sustained moves lasting several months. Previous breakouts from similar formations resulted in multi-hundred percent gains for Bitcoin holders.
Fed Policy and Institutional Demand
Political pressure on Federal Reserve policy continues mounting as Donald Trump calls for aggressive 100 basis point rate cuts. The former president criticized Jerome Powell’s approach following weak August employment data.
Job creation fell to just 22,000 positions versus expectations of 75,000, while unemployment reached 4.3% – a four-year high. These metrics support arguments for more aggressive monetary easing.
While markets currently price in smaller 25 basis point cuts, Trump’s position has amplified speculation about deeper reductions. Lower interest rates historically benefit Bitcoin by reducing opportunity costs of holding non-yielding assets.
Institutional adoption continues expanding with Metaplanet announcing plans to deploy $1.4 billion toward Bitcoin purchases. This follows their recent capital raise and represents continued corporate treasury allocation trends.
Spot Bitcoin ETF flows recently turned positive after periods of outflows. Santiment data shows institutional money returning while retail investors exit positions, a pattern that historically precedes major rallies.
Bitcoin Price Prediction
The cup-and-handle pattern on Bitcoin’s monthly chart completed its breakout above $69,000 in November 2024. This formation projects a maximum target around $305,000 for the 2025-2026 period, representing over 170% upside potential.
However, technical patterns don’t guarantee full target achievement. Historical data shows approximately 61% of cup-and-handle formations reach their projected levels.
Current price action suggests Bitcoin remains in a classic bull market correction phase following all-time highs. Support levels around $104,000 could provide the foundation for the next major upward leg.
Get 3 Free Stock Ebooks
Discover top-performing stocks in AI, Crypto, and Technology with expert analysis.
- Top 10 AI Stocks - Leading AI companies
- Top 10 Crypto Stocks - Blockchain leaders
- Top 10 Tech Stocks - Tech giants

