
 Price: Can S&P Index Listing Trigger Breakout Rally")
TLDR
- Cardano joined the S&P Digital Markets 50 Index, increasing institutional visibility and credibility
- ADA price consolidates at $0.82 inside a symmetrical triangle pattern showing reduced volatility
- Strong buy support exists near $0.78 while the token holds above its 50-week exponential moving average
- Profit-taking activity spiked to its highest level since September 23 as holders sell at gains
- Bearish bets reached the highest monthly level with long-to-short ratio dropping to 0.81
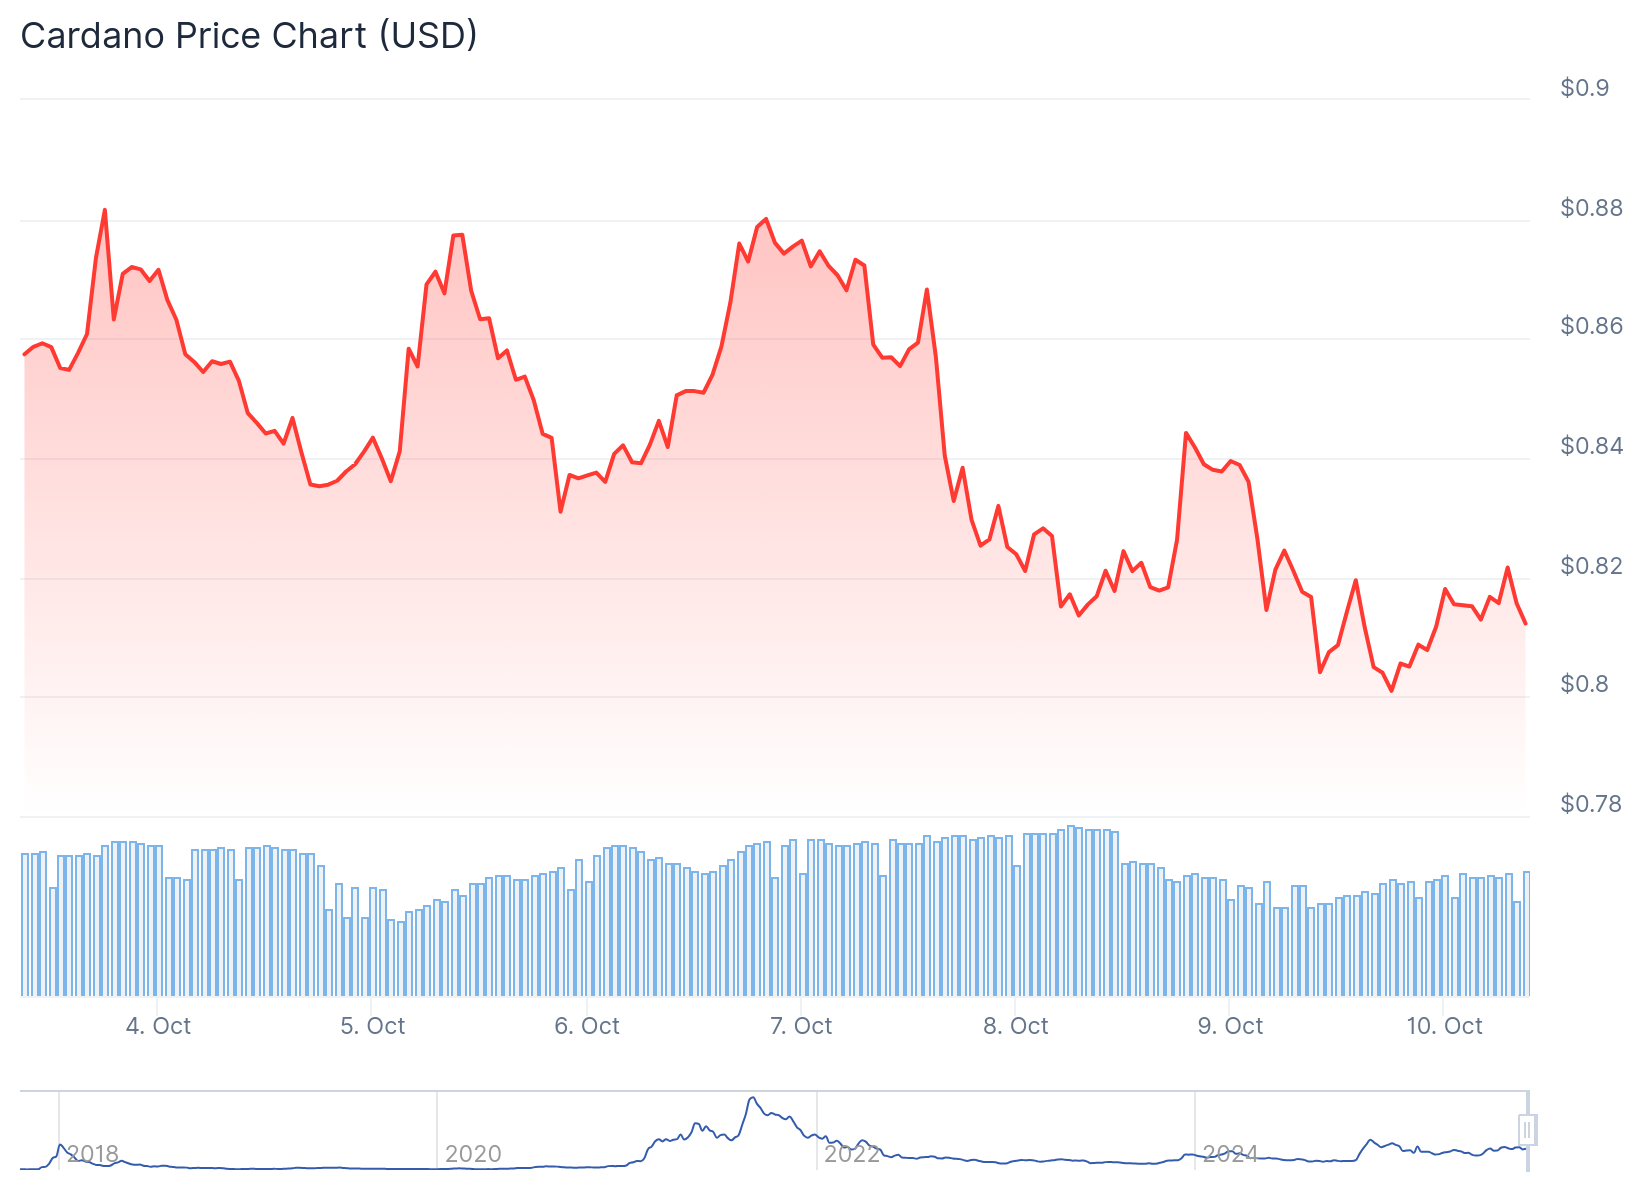
Cardano price traded around $0.82 in early October 2025 as traders monitored whether institutional developments could drive the token above $1. The altcoin declined more than 3% during the week while showing mixed signals from technical and on-chain indicators.
The blockchain network was added to the S&P Digital Markets 50 Index. This benchmark tracks the 50 most relevant digital assets for traditional finance participants.
Index inclusion typically enhances credibility for cryptocurrency projects. Funds that track or benchmark against these indices may allocate capital to included assets.
The listing places Cardano alongside Bitcoin and Ethereum in a global benchmark. This signals growing recognition from traditional markets beyond retail investors.
The development occurred during renewed speculation about altcoin exchange-traded products. Participants continue evaluating how approved ETF applications might reshape capital flows.
Symmetrical Triangle Shows Tightening Volatility
Technical analysts identified a symmetrical triangle pattern in Cardano price action. Analyst TheDAppAnalyst noted the range was tightening as it approached the triangle’s apex.

This pattern usually appears before volatility expansion. It shows equilibrium between buyers and sellers with neither side dominating.
A breakout above $0.90 resistance would confirm bullish continuation. Closes below $0.78-$0.80 risk breaking the pattern downward.
The token showed a 0.27% gain in 24 hours but posted a 5.04% weekly decline. Monthly losses reached 7.39%.
The relative strength index sat at 45, indicating neutral conditions. Cardano held above its 50-week exponential moving average around $0.77-$0.80.
This moving average serves as critical support. The last time ADA defended this level, it advanced toward $1.
Key resistance levels sit between $0.95 and $1.00. This zone represents the threshold needed for confirmed bullish reversal.
Buy Walls Support Price Despite Profit-Taking
Order book data revealed dense buy walls near $0.78. Market aggregator CW8900 reported bids repeatedly absorbed selling pressure at that level.
This creates psychological and structural support. The pattern indicates traders positioning for medium-term recovery rather than short-term moves.
Santiment’s Network Realized Profit/Loss metric showed increased profit-taking this week. The indicator spiked Thursday to its highest level since September 23.
This spike means holders are selling at profit. The activity creates selling pressure on the token.
CoinGlass data showed the ADA long-to-short ratio at 0.81 on Friday. This marked the highest bearish level in over a month.
Ratios below one reflect bearish sentiment in derivatives markets. More traders are betting on price declines.
Technical Indicators Signal Potential Downtrend
The Moving Average Convergence Divergence indicator flipped bearish Thursday. This signal suggests a potential downward trend starting.
If ADA breaks below the ascending trendline, it could fall toward support at $0.70. Recovery above $0.84 could enable a rally toward $1.
On-chain data showed accumulation among larger holders. Analysts linked this to institutional confidence following the index inclusion.
The confluence of institutional visibility, technical consolidation, and buy-side demand positions ADA for potential volatility breakout. Volume confirmation around the triangle apex will determine direction.
At press time, Cardano price traded near $0.81 on Friday while holding above key support levels with strong buy walls protecting downside risk.
Get 3 Free Stock Ebooks
Discover top-performing stocks in AI, Crypto, and Technology with expert analysis.
- Top 10 AI Stocks - Leading AI companies
- Top 10 Crypto Stocks - Blockchain leaders
- Top 10 Tech Stocks - Tech giants

