TLDR
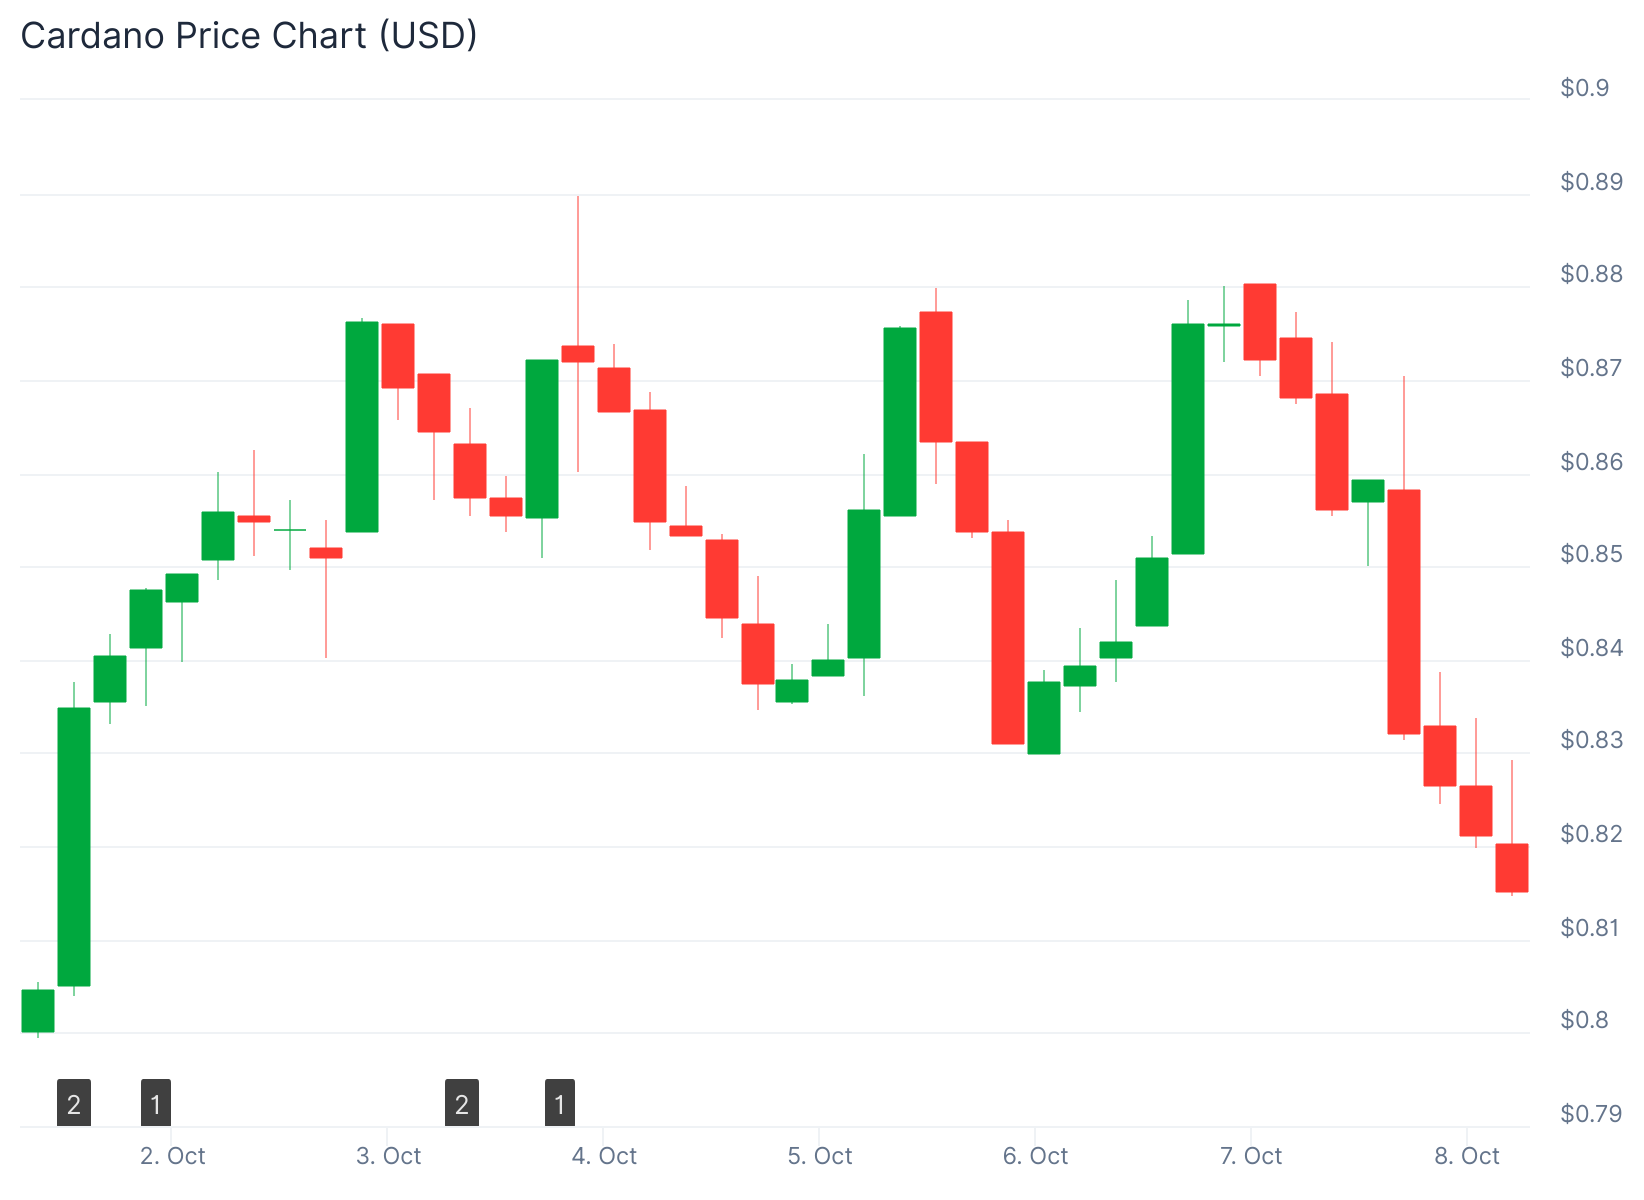
- Cardano price fell 6% Tuesday and trades below $0.82 as selling pressure mounts across spot and derivatives markets
- Hashdex will add ADA to its Nasdaq Crypto Index U.S. ETF, marking a step forward for institutional adoption
- Cardano Foundation’s 2025 roadmap features DeFi liquidity fund, $10M real-world asset initiative, and expanded governance delegation
- Technical indicators including RSI at 45 and potential MACD bearish crossover suggest continued downside risk toward $0.76
- Historical price patterns from 2020-2021 bull run show similarities to current setup, with analyst targets at $2.77, $3.29, and $3.74
Cardano price is facing downward pressure this week. ADA dropped nearly 6% on Tuesday and continues declining on Wednesday, currently trading below the $0.82 level.

The cryptocurrency failed to maintain support at $0.84. It broke below the 61.8% Fibonacci retracement level at $0.82, triggering additional selling.
Market data reveals increasing bearish sentiment. CryptoQuant’s Spot Taker CVD metric for Cardano shows negative values that have climbed steadily since mid-July. This indicator measures the cumulative difference between market buy and sell volumes over three months.
%20(2)-1759899301831-1759899301833.png&w=1536&q=95)
The negative reading indicates a Taker Sell Dominant Phase. Aggressive sellers are outnumbering buyers in current market conditions.
Derivatives market data reinforces the bearish outlook. CoinGlass reports Cardano’s long-to-short ratio at 0.89, approaching its monthly peak. A ratio below one indicates more traders are betting on price declines rather than gains.
Technical Analysis Points to Further Downside
Technical indicators confirm weakening momentum. The Relative Strength Index on the daily chart sits at 45, below the neutral 50 level. This reading suggests bearish momentum is building strength.
The Moving Average Convergence Divergence indicator is nearing a bearish crossover. If this crossover confirms, it would add further weight to the negative outlook.
Cardano price could test the 200-day Exponential Moving Average at $0.76 if selling continues. This level represents the next major support zone.
However, a recovery above $0.84 that holds could shift momentum. Such a move might push ADA toward the $1.00 psychological level.
Hashdex ETF Addition Brings Institutional Credibility
Despite short-term weakness, positive institutional developments are unfolding. Hashdex confirmed it will include ADA in its Nasdaq Crypto Index U.S. ETF.
This addition strengthens Cardano’s presence in traditional finance markets. The move could bring new liquidity flows into the asset.
The Cardano Foundation unveiled its 2025 roadmap with multiple growth initiatives. Plans include expanding the Web3 team and creating a substantial ADA liquidity fund for DeFi development.
The foundation will add 2 million ADA to its Venture Hub. It will delegate 220 million ADA to new DReps for enhanced governance participation.
A $10 million real-world asset project is launching. The marketing budget will increase by 12% to boost ecosystem visibility.
Historical Patterns Suggest Long-Term Potential
Analyst Javon Marks identified a repeating macro pattern in Cardano’s price chart. The current structure mirrors the setup from the 2020-2021 bull cycle.
During that period, Cardano surged from approximately $0.05 to $3.10 by September 2021. The Shelley Upgrade powered that rally by introducing staking capabilities. Over 70% of ADA supply was staked at the cycle peak.
The current pattern shows similar characteristics. Extended accumulation phases have historically preceded major breakouts.
If the pattern repeats, potential price targets sit at $2.77, $3.29, and $3.74. These levels align with Fibonacci extensions and previous resistance zones.
Maintaining support above $1.00 remains critical for the bullish long-term scenario to develop.
The contrast between near-term selling pressure and institutional adoption creates a mixed outlook for Cardano price in coming weeks.


