
 Price: Decision Time Soon as Triangle Formation Tightens")
TLDR
- Cardano is consolidating at $0.84 with a symmetrical triangle pattern nearing completion in late October
- Strong support zone established between $0.78 and $0.80 with heavy buying interest on order books
- S&P Digital Markets 50 index addition increases institutional exposure for ADA
- Resistance at $0.90 represents the critical breakout level for bullish continuation
- 50-week moving average support mirrors previous setups that led to $1 price targets
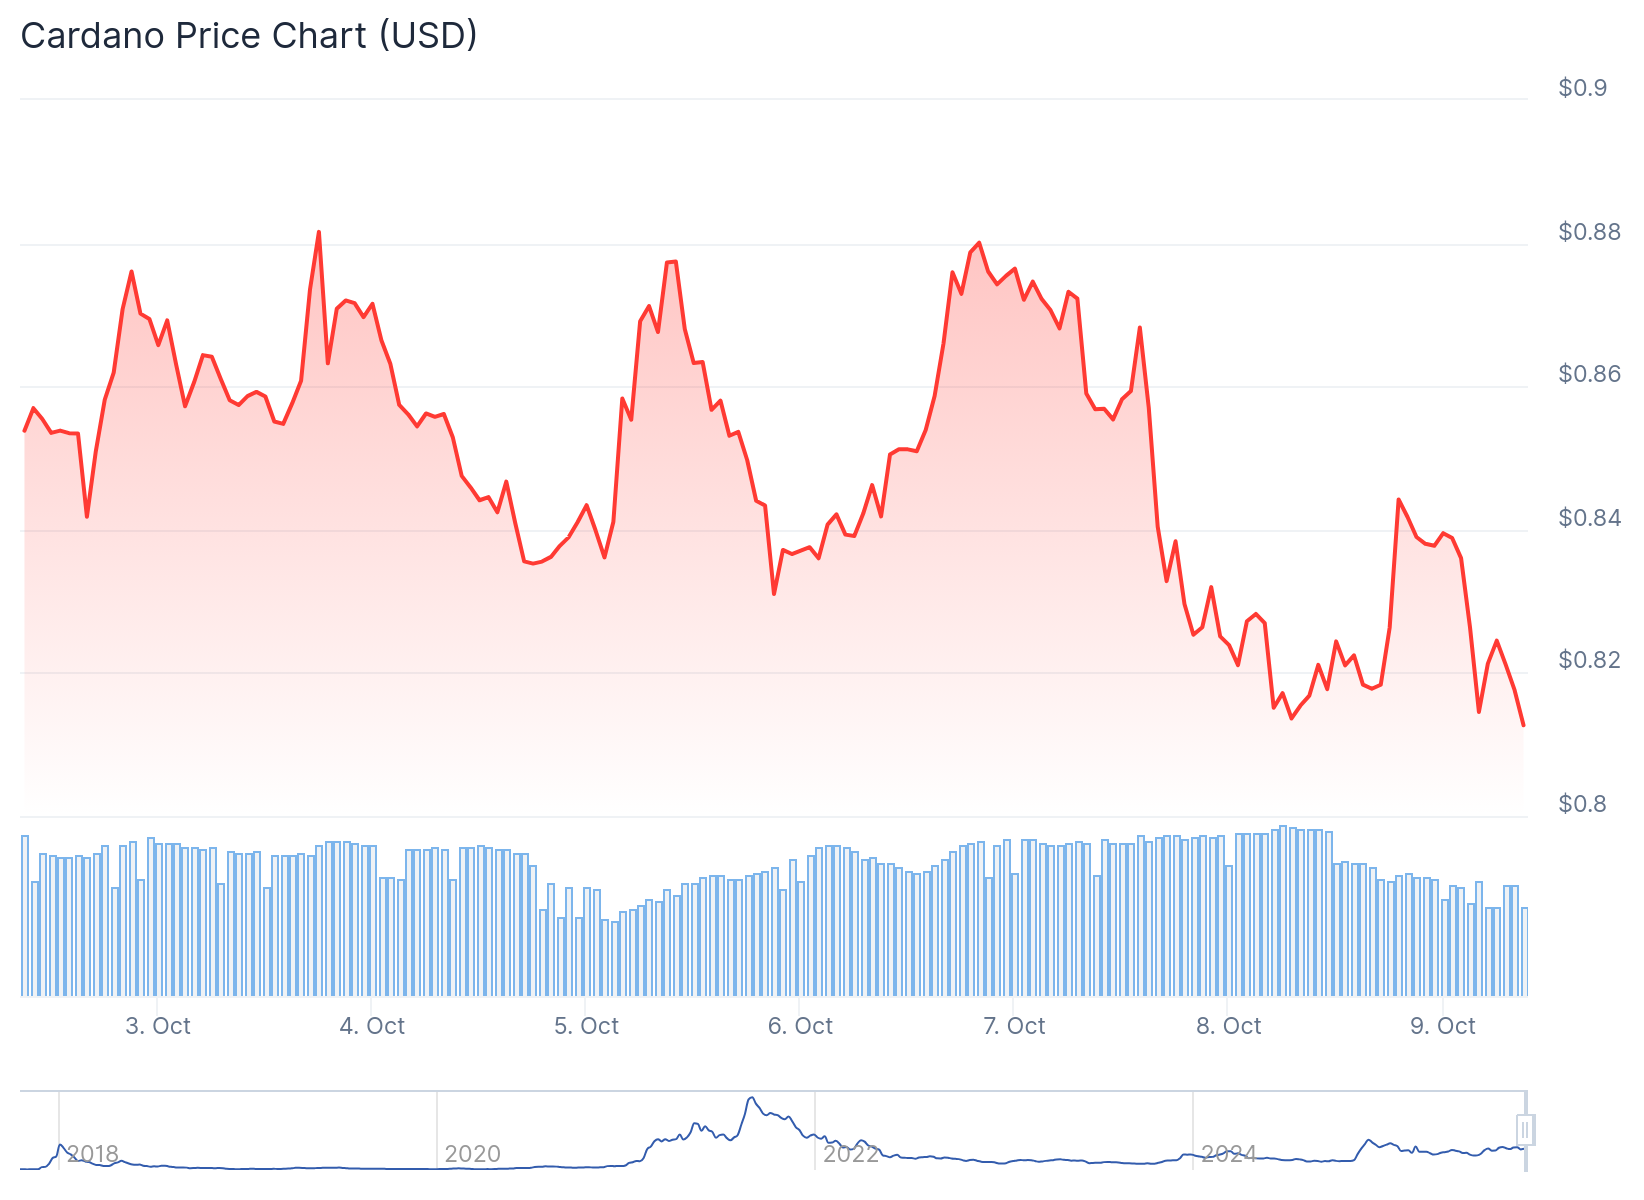
Cardano is currently trading at $0.84 after posting a 1.34% increase in the last 24 hours. The cryptocurrency has been consolidating within a narrowing price range that technical analysts are monitoring.
The price action is forming a symmetrical triangle pattern on the charts. This technical formation occurs when the price creates lower highs and higher lows, causing support and resistance lines to converge toward an apex point.
According to technical analysis, the apex of this triangle is expected to arrive in late October. This timing coincides with historical patterns showing November as a favorable month for altcoin performance.
Support and Resistance Define Trading Range
The key support level for Cardano sits between $0.78 and $0.80. Order book data reveals concentrated buying interest at these price points, creating what traders call a buy wall.
ADA briefly dropped below the $0.80 support level before quickly recovering. This type of price action typically clears out weak positions before a larger directional move.
The critical resistance level is positioned at $0.90. A confirmed break above this level would signal bullish continuation for the cryptocurrency.

Above $0.90, the next resistance zone appears between $0.95 and $1.00. These levels represent major psychological barriers for the asset.
The 50-week exponential moving average continues to provide underlying support. Historical data shows that when Cardano maintains prices above this moving average, rallies toward $1 have followed.
Institutional Recognition Grows
Cardano recently secured a position in the S&P Digital Markets 50 index. This benchmark tracks the largest digital assets in the cryptocurrency market.
The index inclusion provides traditional finance institutions with a standardized way to track ADA. This can lead to increased visibility among institutional investors and funds that follow these benchmarks.
Index inclusion represents a form of validation for cryptocurrency projects. It signals that the asset has achieved sufficient market capitalization and liquidity to warrant institutional attention.
Market Structure and Catalysts
The symmetrical triangle pattern shows tightening volatility before an expected expansion. Price compression typically precedes larger directional moves in either direction.
Buyers have been defending the lower support levels while sellers continue to cap upward movements. This creates the converging pattern visible on the charts.
Trading volume will play a crucial role in confirming any breakout. Strong volume accompanying a move above $0.90 would provide greater confidence in the breakout’s sustainability.
Speculation around potential catalysts has increased. Market participants are discussing possible stablecoin launches on the Cardano network and growing interest in cryptocurrency exchange-traded funds.
The current technical setup occurs while Bitcoin has been approaching all-time high levels. Altcoins often follow Bitcoin’s lead after periods of consolidation.
If support at $0.78 fails to hold, the next downside target would be around $0.75. Conversely, a confirmed break above $0.90 opens the path toward the $1 price level.
The combination of technical patterns, index inclusion, and market timing has drawn increased attention from traders. The late October timeframe represents a decision point for Cardano’s near-term price direction.
Get 3 Free Stock Ebooks
Discover top-performing stocks in AI, Crypto, and Technology with expert analysis.
- Top 10 AI Stocks - Leading AI companies
- Top 10 Crypto Stocks - Blockchain leaders
- Top 10 Tech Stocks - Tech giants

