
 Price: Breakout Confirmed as Whales Accumulate 30 Million Tokens")
TLDR
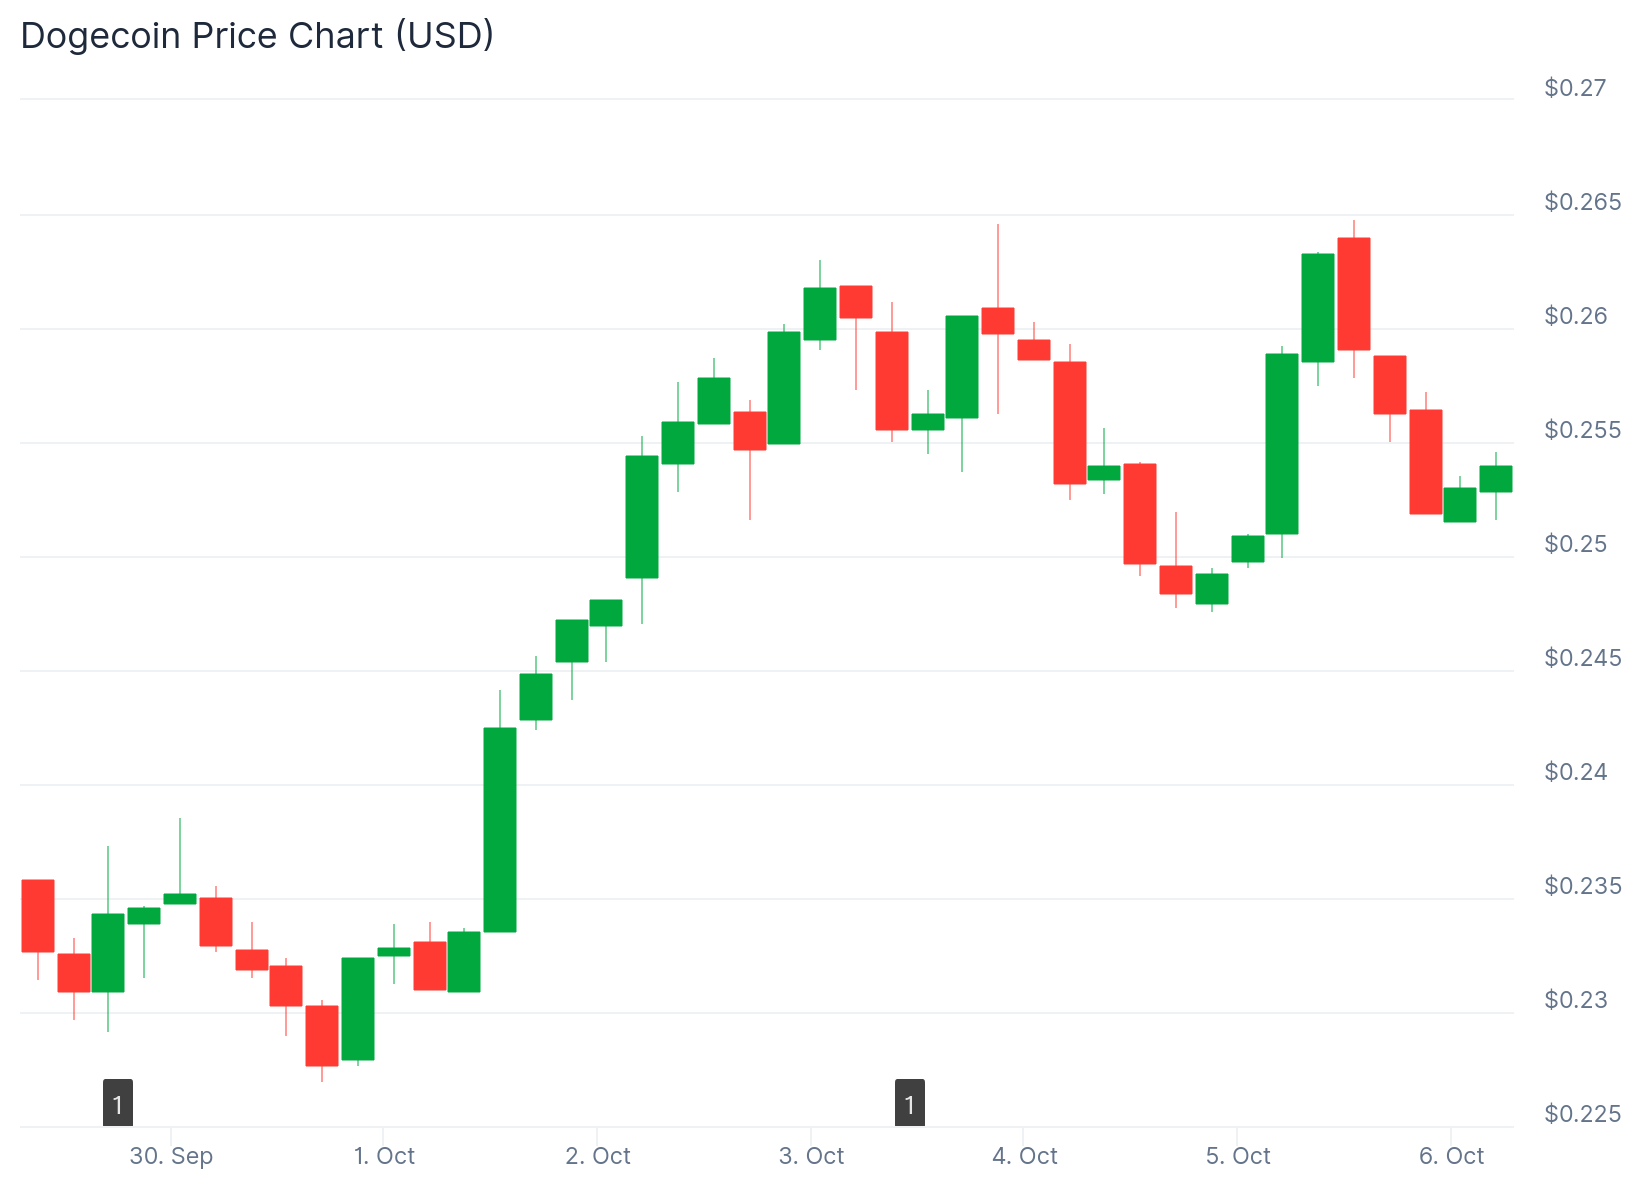
- Dogecoin price rebounded 15% from $0.25 support zone to reach $0.26 with strong technical confirmation
- Large holders purchased over 30 million DOGE tokens while exchange outflows topped $25 million in 24 hours
- DMI and ADX indicators show buyer control with rising trend strength
- Chart patterns mirror 2022-2023 formations that preceded previous rallies
- Rising megaphone pattern suggests potential advance toward $0.70 if resistance breaks
Dogecoin price currently trades at $0.26 after posting gains of 3.3% over 24 hours and 14.6% across the past week. The meme token completed a 15% rebound from its key support level near $0.25.
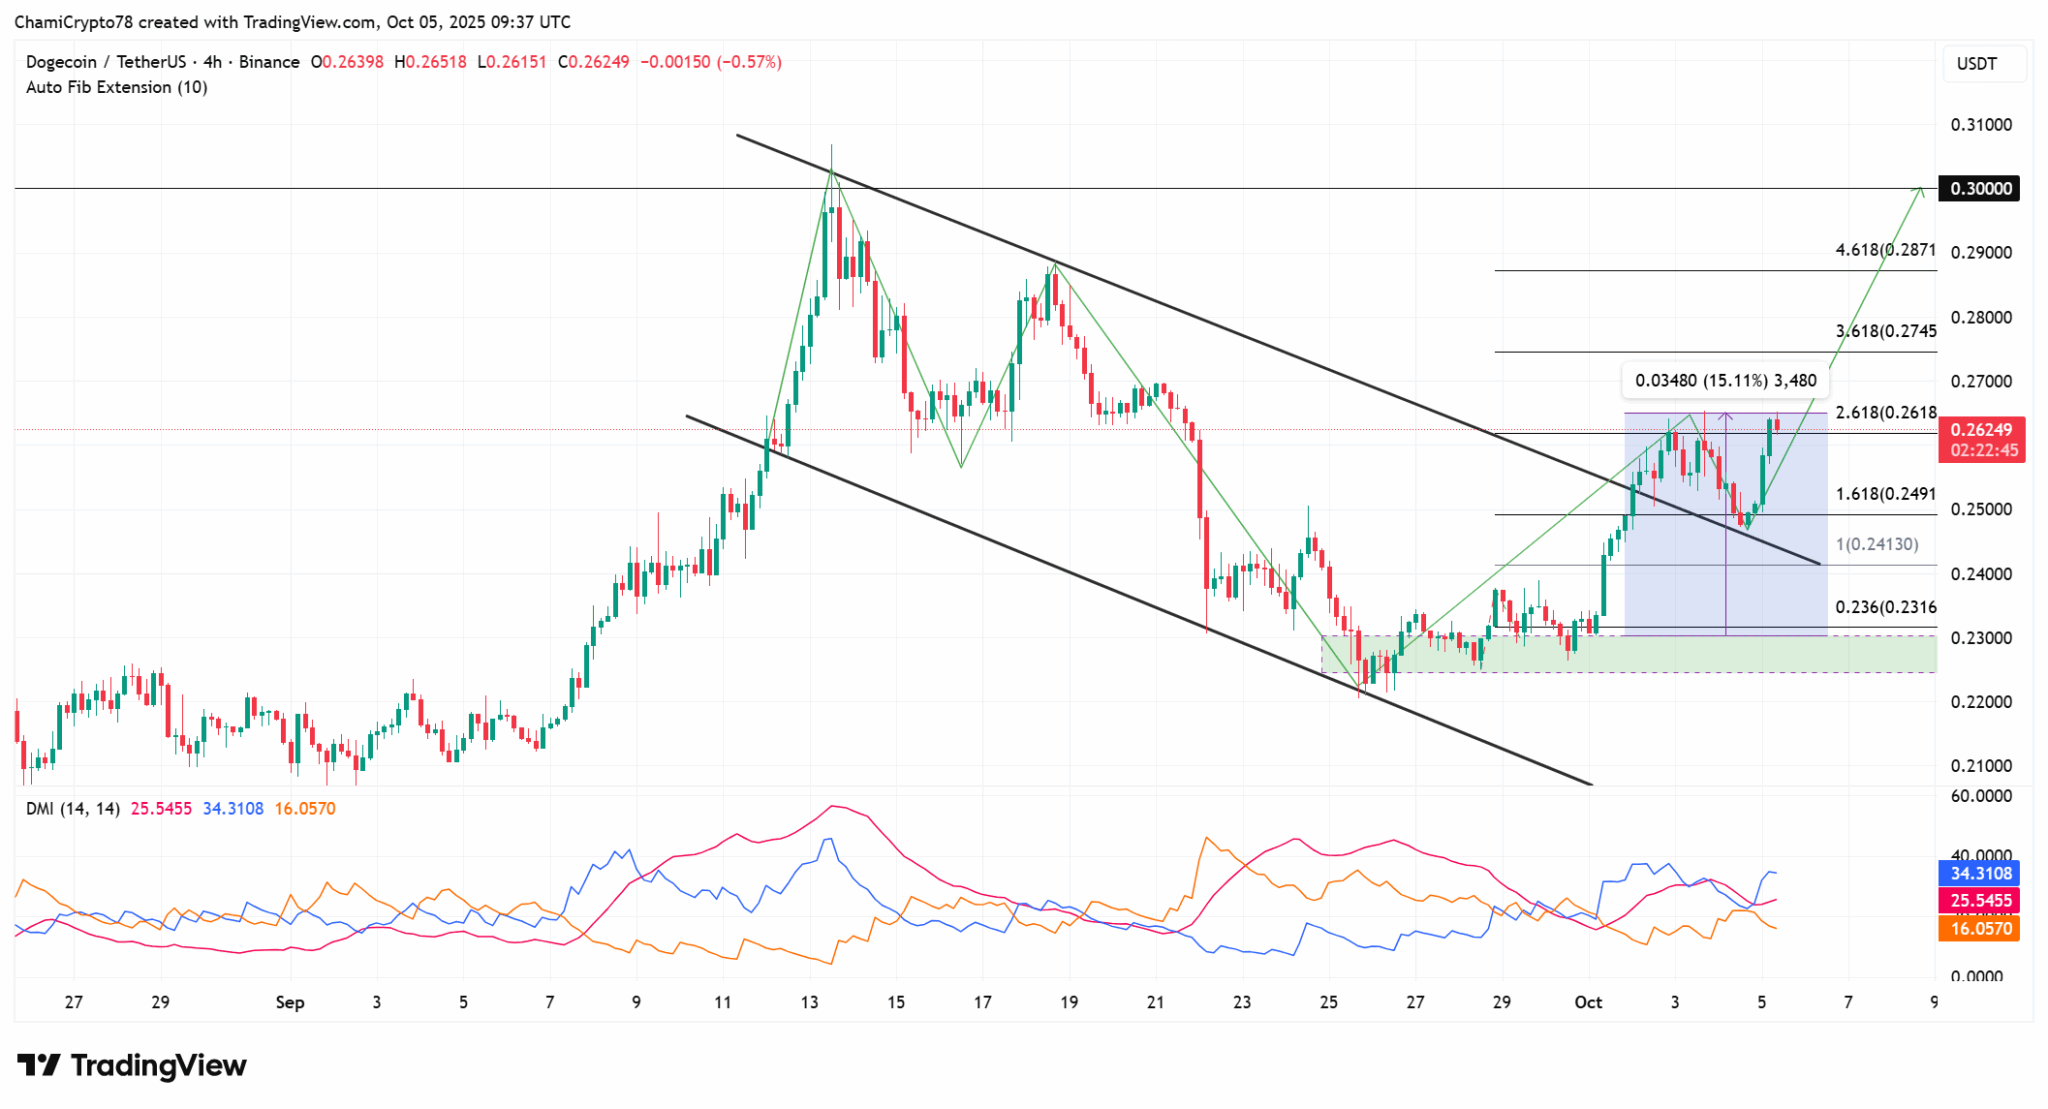
Technical analysis shows DOGE broke out from a descending channel formation. The price then retested the upper boundary of this channel as new support. This retest validated the breakout and confirmed a bullish reversal pattern.
The $0.25 level now functions as critical support for the current uptrend. Holding above this threshold could enable further gains toward $0.30. This represents the next major resistance zone for Dogecoin price.
The Directional Movement Index displays the +DI line above the -DI line. The Average Directional Index is rising as well. Both indicators confirm strengthening bullish momentum and active buyer participation.
Whale Buying and Exchange Outflows Increase
On-chain metrics revealed large holders added more than 30 million DOGE tokens in a 24-hour period. This whale accumulation typically signals confidence from institutional investors expecting price appreciation.
Data from CoinGlass showed net outflows from exchanges exceeded $25 million. These outflows indicate tokens moving from trading platforms into private storage wallets. Declining exchange balances usually reflect reduced selling pressure.

When supply tightens through outflows while demand remains steady, conditions favor upward price movement. The combination of whale buying and exchange withdrawals creates a supportive environment for Dogecoin price growth.
Historical Patterns Point to Potential Rally
Analyst Tardigrade identified repeating fractal patterns on the two-week chart. These formations match structures seen during 2022 and 2023 before previous bull runs. DOGE moved within descending triangles during those periods before breaking higher.
The current setup shows similar characteristics. The token pushed through a falling trendline and established higher lows. Rising support levels indicate accumulation as buyers increase positions.
Another analyst highlighted a rising megaphone pattern on the three-day timeframe. This formation shows widening price swings that often precede breakouts. The upper boundary serves as the next resistance target.
A close above this megaphone resistance could trigger acceleration toward $0.70 according to technical projections. Continued momentum might push Dogecoin price closer to the $1 psychological level.
Momentum Indicators Turn Positive
The Relative Strength Index moved toward neutral territory after an extended decline. The MACD indicator turned positive for the first time since mid-summer. These momentum signals show early signs of trend reversal.
Historical patterns show capital often rotates from Bitcoin into altcoins when BTC volatility decreases. This rotation helped boost DOGE trading volumes through October as traders sought alternative opportunities.
Network activity provides additional support beyond speculative trading. Dogecoin continues integration into payment systems and tipping applications. These use cases maintain steady transaction volumes.
Businesses adding low-fee transfer options increasingly include DOGE support. Community engagement across social platforms maintains liquidity and user awareness.
The technical breakout combined with whale accumulation and falling exchange reserves creates favorable conditions. If the $0.25 support holds with sustained volume, Dogecoin price appears positioned to test $0.30 resistance in the near term.
Get 3 Free Stock Ebooks
Discover top-performing stocks in AI, Crypto, and Technology with expert analysis.
- Top 10 AI Stocks - Leading AI companies
- Top 10 Crypto Stocks - Blockchain leaders
- Top 10 Tech Stocks - Tech giants

