
 Price: Bulls Eye Breakout as Golden Cross Pattern Takes Shape")
TLDR
- Dogecoin is forming a Golden Cross pattern, a technical signal that often indicates bullish momentum ahead
- The cryptocurrency held support at $0.22, confirming a hidden bullish divergence on the RSI indicator
- Analysts identify $0.33 as the critical resistance level that could unlock a 60% rally to $0.37
- MACD indicator turned green on the 12-hour chart, showing increased buying pressure
- Long-term projections suggest Dogecoin could climb to $1 by 2026 based on weekly consolidation patterns
Dogecoin is nearing completion of a Golden Cross pattern across multiple timeframes. This technical formation happens when a shorter moving average crosses above a longer moving average.
Crypto analyst Cas Abbe highlighted the pattern formation on X. He pointed out that previous Golden Cross events in Dogecoin have triggered rallies in both DOGE and the wider altcoin market.
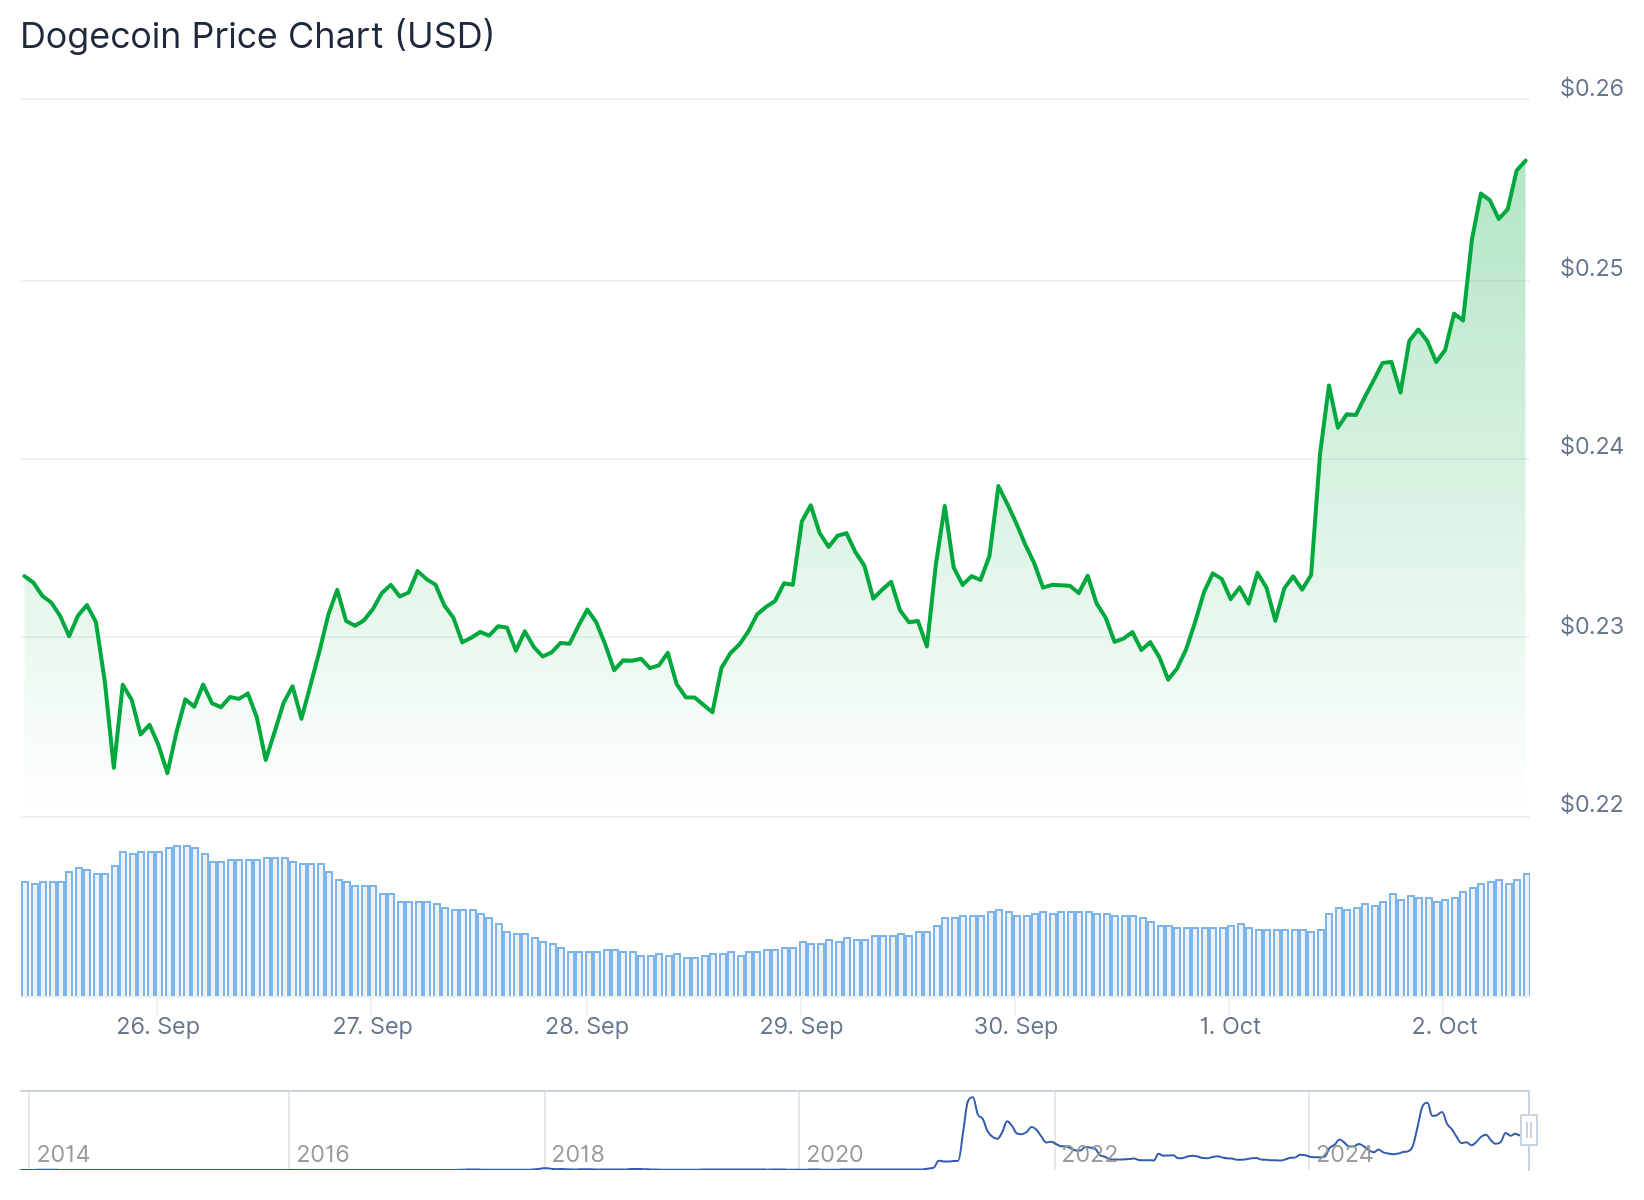
The meme coin trades around $0.23 after rebounding from support near $0.21. Analysis shows the price climbing toward an upper resistance channel with $0.33 as the main barrier.
Cas Abbe’s projections show Dogecoin potentially reaching $0.37. This would mark a roughly 60% gain from current price levels.
Another analyst, Trader Tardigrade, examined the 12-hour chart and spotted a Golden Cross on the MACD indicator. The histogram has flipped green, typically signaling rising buying pressure. His analysis targets the $0.32 to $0.33 zone.
Technical Support Holds at Key Level
Dogecoin successfully defended the $0.22 support zone. This price represents a confluence where the 0.618 Fibonacci retracement meets the point of control.

The defense of this level confirmed a hidden bullish divergence. This pattern occurs when price forms higher lows while the RSI makes lower lows. It generally indicates uptrend continuation.
Market structure displays consecutive higher lows. This demonstrates that demand has stayed strong during corrections. The bullish setup remains valid as long as price holds above $0.22.
Resistance at Value Area High
The value area high stands as the next major challenge for Dogecoin. Earlier rallies stalled at this level due to weak volume.
Current data shows volume inflows are improving. Sustained buying will be needed to push through the value area high and reach the $0.34 target zone.
Breaking above this resistance would confirm uptrend continuation. It could open opportunities for additional gains in the coming weeks.
Path to $1 Mapped Out
Analyst Solid identified a broader consolidation pattern on Dogecoin’s weekly chart. The formation started after the 2021 peak and could serve as a base for future growth.
His projection shows Dogecoin potentially reaching $1 by 2026. This represents a 334% increase from current levels. The trajectory suggests steady progress through 2025 before acceleration in 2026.
The analysis indicates the consolidation phase may be ending. Bullish momentum appears to be building after months of sideways movement.
Dogecoin maintains position above the $0.22 support with several bullish indicators converging. The cryptocurrency faces a decisive test at $0.33 resistance.
Get 3 Free Stock Ebooks
Discover top-performing stocks in AI, Crypto, and Technology with expert analysis.
- Top 10 AI Stocks - Leading AI companies
- Top 10 Crypto Stocks - Blockchain leaders
- Top 10 Tech Stocks - Tech giants

