
 Price: Key Support Levels Holds as Bullish Pattern Could Spark 30% Rally")
TLDR
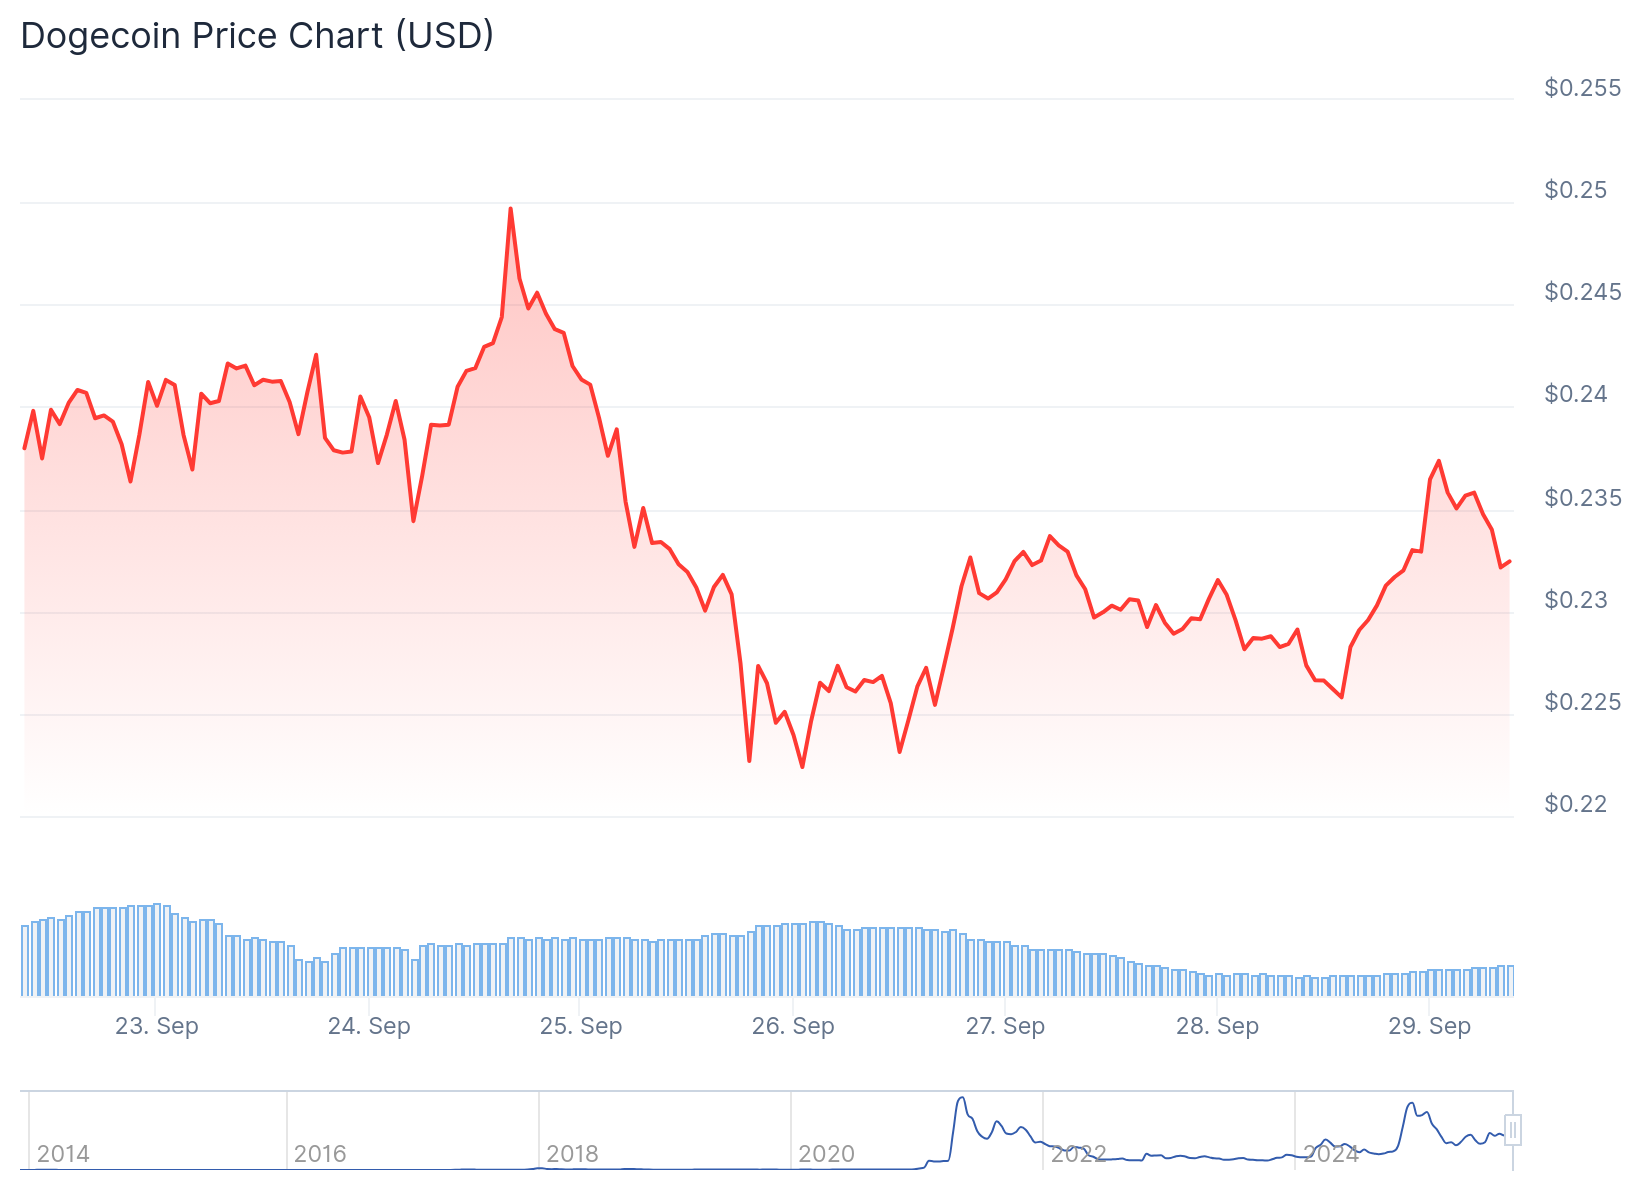
- Dogecoin dropped 25% from $0.30 September highs, now testing crucial $0.20-$0.22 support zone
- Technical indicators show bullish divergence as RSI improves while price weakens
- Historical trendline support has produced 30-40% rallies when successfully defended
- Analyst data reveals heavy transaction activity around $0.20 level suggesting strong holder base
- Pattern recognition points to potential 150% surge if breakout occurs above resistance
Dogecoin price has experienced a sharp pullback after reaching February highs near $0.30 on September 13. The popular meme cryptocurrency has lost approximately 25% of its value over the past two weeks.
This decline has brought DOGE back to a critical technical area that could determine its next major move. The $0.20-$0.22 price range represents a confluence of multiple support levels.
Despite recent weakness, Dogecoin maintains a longer-term uptrend that began in June. The token has gained roughly 60% over the past three months, showing underlying strength before the current correction.
A rising trendline has provided consistent support since April. This technical level has historically acted as a launchpad for rallies ranging from 30-40% when successfully defended by buyers.
The current support zone includes several important elements. The area contains horizontal price support, the 200-day exponential moving average, and the ascending trendline confluence.
Technical Indicators Signal Potential Reversal
The Relative Strength Index currently reads 43, indicating weakening momentum but not yet oversold conditions. Values below 50 suggest diminishing bullish pressure, while readings near 30 would indicate oversold territory.

A bullish divergence is developing between price action and the RSI momentum oscillator. While Dogecoin has continued making lower lows, the RSI has begun forming higher lows and curling upward.
This divergence pattern often signals that selling pressure is exhausting itself. When combined with strong support levels, it frequently precedes tradable bounces in cryptocurrency markets.
Analyst Ali Martinez has identified the $0.20 level as Dogecoin’s most critical support using Realized Price Distribution data. This metric tracks where coins last moved on-chain, revealing potential holder concentration areas.
The analysis shows a large cluster of historical transactions around $0.20. This suggests many investors established positions near this price point, creating natural support as holders resist selling at losses.
Pattern Analysis Points to Explosive Potential
Technical analyst JAVON MARKS has identified a recurring three-phase pattern in Dogecoin’s price history. This cycle includes accumulation phases with higher lows, explosive breakouts, and elevated consolidation periods.
Current price structure mirrors previous setups that preceded major rallies. The ascending support pattern matches technical conditions seen before historical parabolic moves.
If this pattern repeats, DOGE could potentially surge 150% from current levels. Such a move would establish new all-time highs, exceeding previous peak performances from the 2021 bull market.
The meme coin maintains strong community backing despite market volatility. This retail support base has demonstrated resilience through multiple market cycles.
A successful defense of the $0.20-$0.22 support zone could trigger a rebound toward $0.27-$0.29. This scenario would deliver approximately 30% gains from current price levels.
Conversely, a decisive break below the support confluence could expose DOGE to further downside toward $0.18. The technical setup presents clear levels for both bullish and bearish outcomes.
Dogecoin currently trades at a pivotal junction where multiple technical factors converge to create a make-or-break moment for the cryptocurrency’s near-term direction.
Get 3 Free Stock Ebooks
Discover top-performing stocks in AI, Crypto, and Technology with expert analysis.
- Top 10 AI Stocks - Leading AI companies
- Top 10 Crypto Stocks - Blockchain leaders
- Top 10 Tech Stocks - Tech giants

