
 Price Rally Sparks Skepticism: Why Analysts See a Fakeout")
Key Takeaways
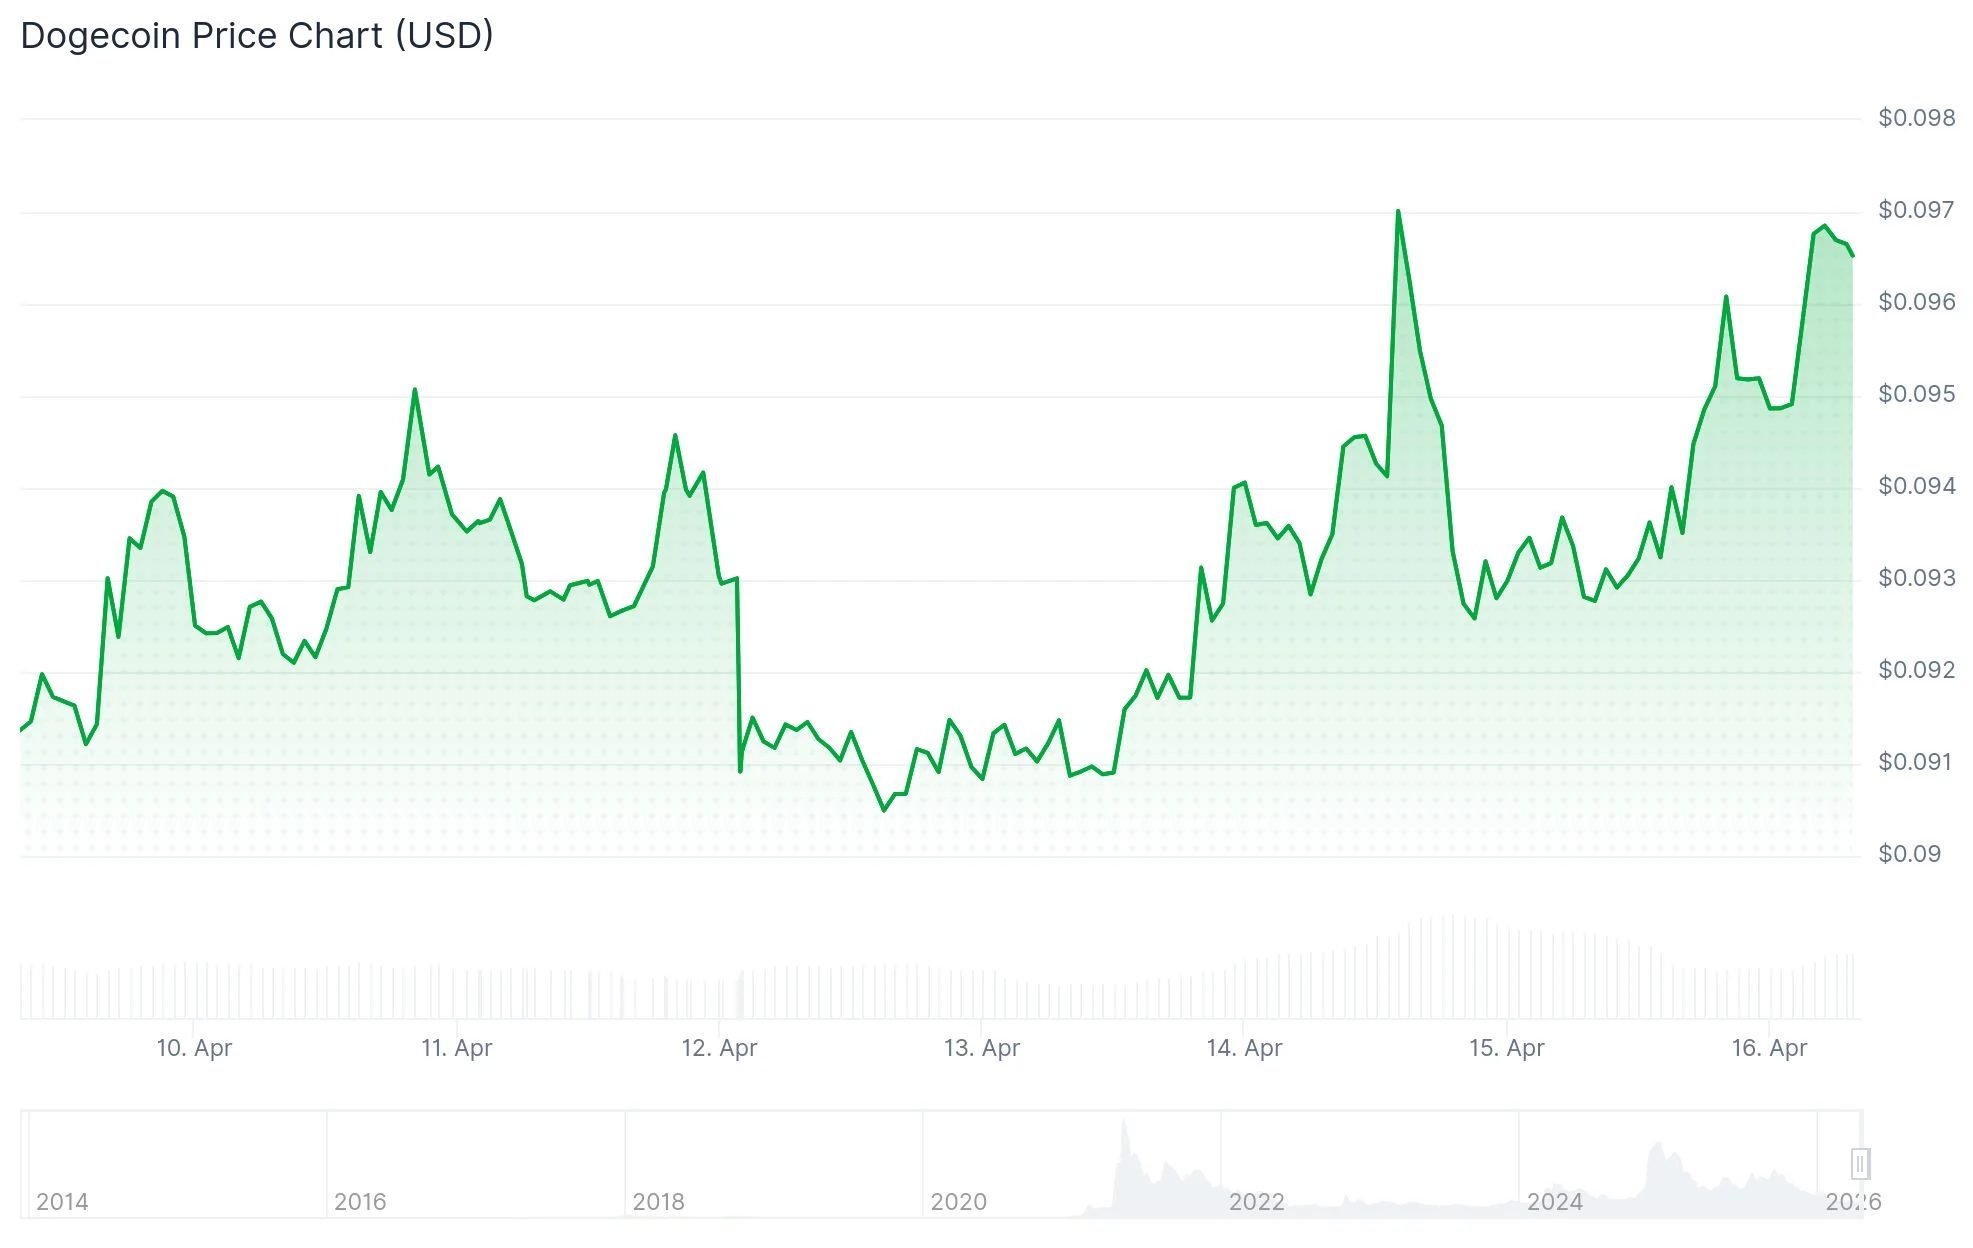
- DOGE is hovering around $0.09, locked in a narrow consolidation pattern without a definitive directional bias.
- Technical indicators show neutral momentum: RSI at 46.30 and a flat MACD signal balanced market forces.
- A 4.5% intraday surge pushed DOGE close to $0.10, outpacing major cryptocurrencies like Bitcoin and Ethereum.
- The upward movement seems fueled by futures activity and leverage rather than genuine blockchain usage growth.
- Technical analyst Ali Charts identified a false breakout pattern on the 12-hour timeframe, projecting a pullback to $0.088.
Dogecoin has positioned itself around the $0.09 mark following an impressive 4.5% surge that momentarily brought prices within striking distance of $0.10. This upward momentum allowed DOGE to surpass the performance of leading cryptocurrencies including Bitcoin and Ethereum during the trading session, attracting attention from short-term speculators.
The price movement carried DOGE from the $0.093 level to $0.098, successfully penetrating the resistance barrier at $0.095 with considerable trading volume backing the advance. The ascent was characterized by a sequence of progressively higher lows before gaining acceleration during the final trading hour.
However, the strength displayed in price action hasn’t been matched by fundamental network metrics. Active wallet addresses on the Dogecoin blockchain continue their downward trajectory, indicating that the recent price appreciation may be primarily attributable to speculative derivatives trading and leveraged positions rather than genuine user adoption and network utilization.
Notable buying pressure emerged during the latter portion of the session, particularly evident during the push past the $0.097 threshold. Trading volume metrics confirmed authentic market participation rather than movements through shallow liquidity pools, suggesting institutional players may have entered positions.
Technical Analyst Identifies Potential False Breakout
Prominent cryptocurrency analyst Ali Charts has identified what appears to be a textbook fakeout formation on the 12-hour chart structure. Dogecoin made an attempt to break free from a descending triangle pattern, but encountered strong resistance at the downward-sloping trendline, which promptly reversed the advance.

According to Ali Charts’ assessment, when a breakout attempt gets rejected with this degree of decisiveness, market participants often seek liquidity at the lower boundary of the formation. The analyst specifically highlighted $0.088 as the probable retest destination, describing this level as the “definitive line in the sand” for Dogecoin’s near-term trajectory.
The Relative Strength Index currently reads 46.30, indicating equilibrium between buying and selling forces in the market. Meanwhile, the MACD histogram displays minimal movement, suggesting that while bearish pressure has diminished, bullish momentum has not yet established dominance.
Critical Price Zones Under Surveillance
Bollinger Band analysis reveals DOGE positioning itself nearer to the lower boundary around $0.09, while the upper band near $0.10 persists as a formidable overhead resistance level.
A cluster of short-term and intermediate-term moving averages converges around the $0.09 zone, strengthening its role as a pivotal support area. Notably, DOGE continues trading substantially beneath its long-term moving average positioned near $0.14, underscoring the prevailing bearish market structure.
Market participants are closely monitoring $0.096 as the immediate support threshold. Maintaining price action above this level would preserve the integrity of the current breakout scenario.
Conversely, $0.104 represents the crucial resistance barrier that must be conquered. A decisive move beyond this point would transform the technical structure toward a more constructive bullish configuration. Should DOGE retreat below the $0.092–$0.090 range, traders anticipate a more substantial corrective decline.
The overarching technical picture continues to reflect a compression phase beneath descending resistance lines rather than a confirmed reversal of the prevailing downtrend.
Get 3 Free Stock Ebooks
Discover top-performing stocks in AI, Crypto, and Technology with expert analysis.
- Top 10 AI Stocks - Leading AI companies
- Top 10 Crypto Stocks - Blockchain leaders
- Top 10 Tech Stocks - Tech giants

