
 Price: Triangle Breakout Could Spark Epic Rally in Q4")
TLDR
- DOGE holds crucial $0.22 support level matching 0.618 Fibonacci retracement zone
- Ascending triangle formation since July shows potential upside target at $0.29
- Multiple resistance rejections at $0.24 create key breakout level for bulls
- Analysts project possible 800% rally to $1.30 if major support levels maintain
- Current price at $0.222 represents make-or-break moment for triangle pattern
Dogecoin price action centers around a critical support test that could determine the meme coin’s next directional move. DOGE trades at $0.222 while defending the pivotal $0.22 zone.
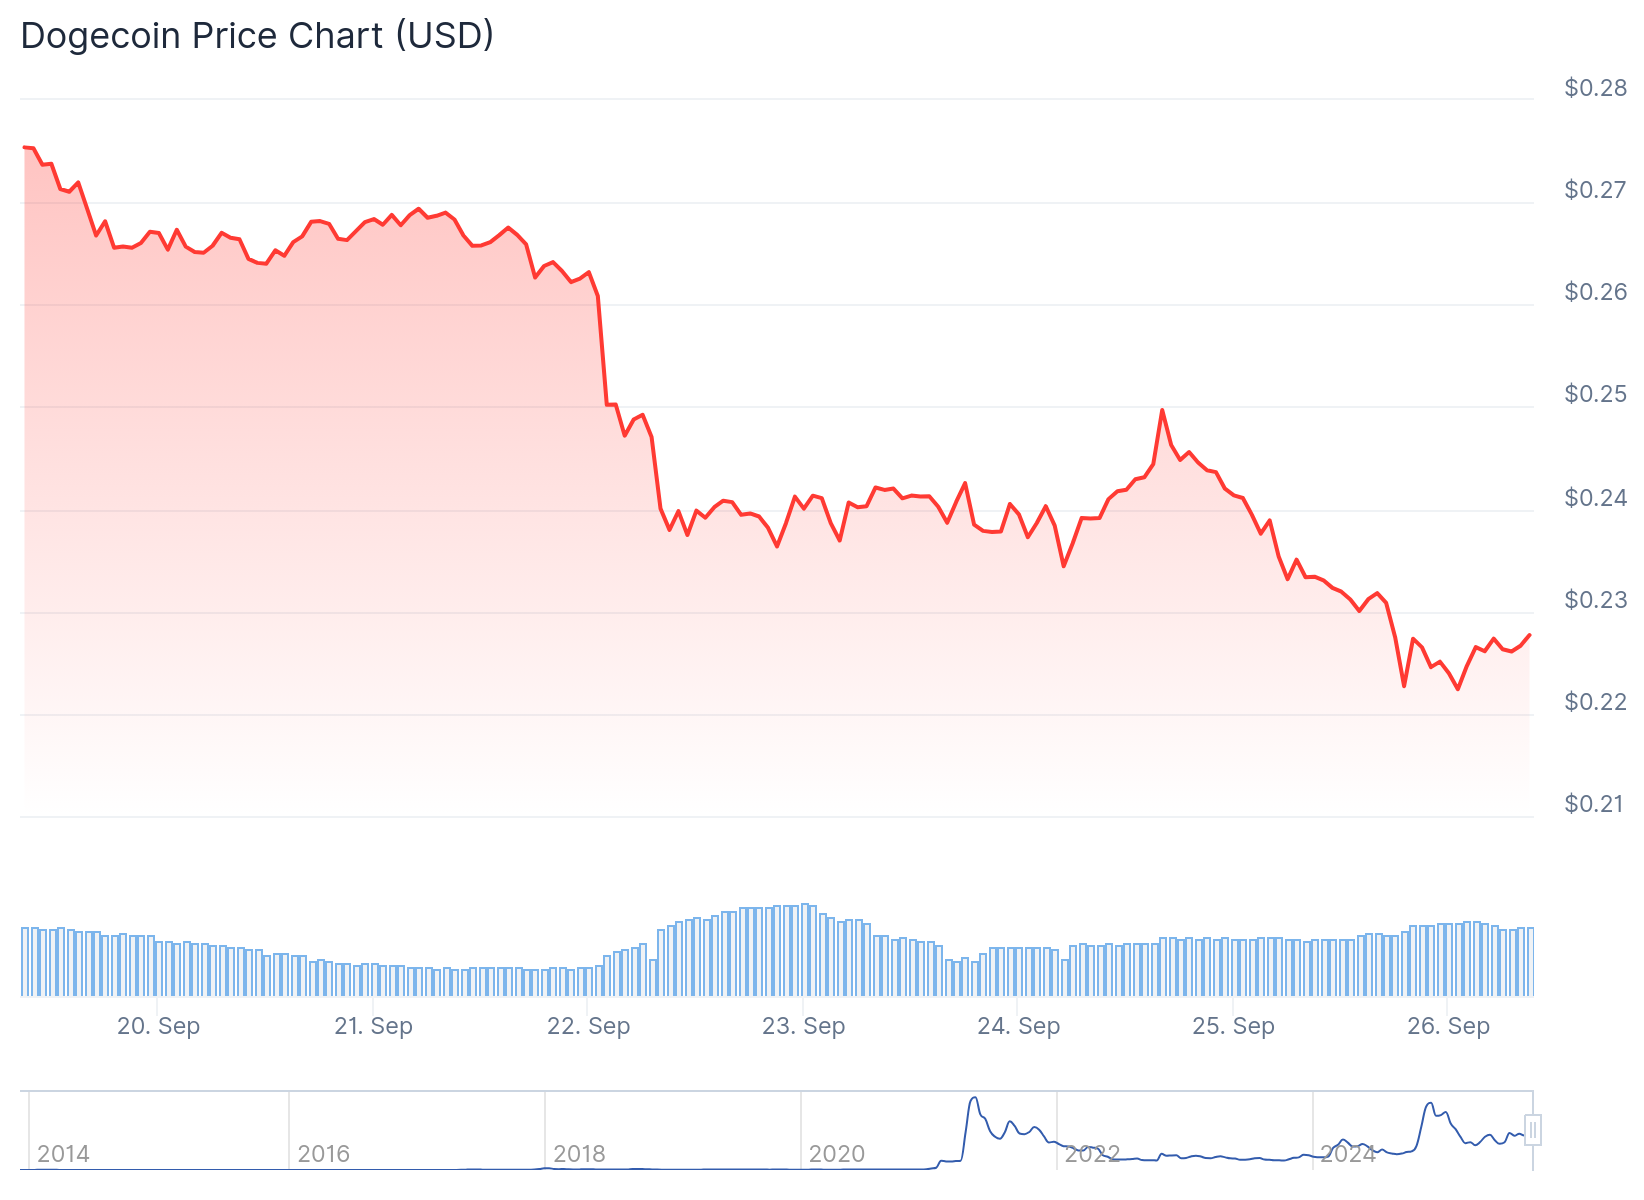
The cryptocurrency has declined 22% over the past week according to market data. Despite recent weakness, DOGE remains approximately 70% below its all-time high of $0.73.
Technical chart analysis reveals an ascending triangle pattern developing since July. This formation places current price action at a crucial decision point for traders.
The $0.22 support level coincides with the 0.618 Fibonacci retracement at $0.2288. This confluence of technical factors makes the zone particularly important for maintaining bullish structure.
DOGE has faced rejection at the $0.24 resistance level on three separate occasions. Additional barriers exist at $0.27 and $0.28 that bulls must overcome for sustained recovery.
Triangle Pattern Points to $0.29 Target
The ascending triangle structure suggests potential consolidation between current levels and $0.29. This target represents the triangle’s apex where price compression typically resolves.

Chart patterns indicate DOGE could experience gradual higher lows while approaching the upper resistance boundary. Breaking above $0.29 would open extended targets at $0.30-$0.32.
More ambitious projections reach $0.38 and $0.42 if momentum builds after triangle resolution. Some analysts forecast potential moves to $1.30, representing 800% gains from current prices.
Historical analysis shows similar setups produced rallies of 300% and 500% in previous cycles. These comparisons reference price movements between September and November of last year.
The key $0.14 level provides major trendline support on weekly timeframes. This threshold represents the ascending trendline’s current position and remains intact despite recent corrections.
Support zones below current price include $0.21, $0.19, and $0.16. These levels have historically provided bounce points during previous downturns.
Economic Backdrop Supports Risk Assets
Recent economic data shows weekly jobless claims fell to 218,000 for the week ending September 20. This reading came below expectations and indicates labor market resilience.
The Commerce Department revised second-quarter GDP estimates higher to 3.8%. Strong consumer spending drove the revision, marking the strongest quarterly growth in over two years.
Such economic indicators could influence investor rotation from traditional assets into cryptocurrencies. This dynamic potentially supports altcoin demand if market conditions align.
Current price action around $0.222 represents a critical juncture for the triangle pattern. Losing the $0.22 support would invalidate the bullish scenario and open deeper retracement risks.
Conversely, defending this zone while building momentum toward $0.24 resistance could trigger the anticipated breakout. The next few trading sessions may determine which scenario unfolds for DOGE price.
Get 3 Free Stock Ebooks
Discover top-performing stocks in AI, Crypto, and Technology with expert analysis.
- Top 10 AI Stocks - Leading AI companies
- Top 10 Crypto Stocks - Blockchain leaders
- Top 10 Tech Stocks - Tech giants

