
 Price: Bulls Face Support Test After $4,800 Rejection")
TLDR
- Ethereum rejected at $4,800 resistance, dropping 3% below $4,500 on Tuesday
- Bearish divergence on four-hour chart signals weakening buyer momentum
- Exchange reserves declined 25% since 2022 to 16.1 million ETH
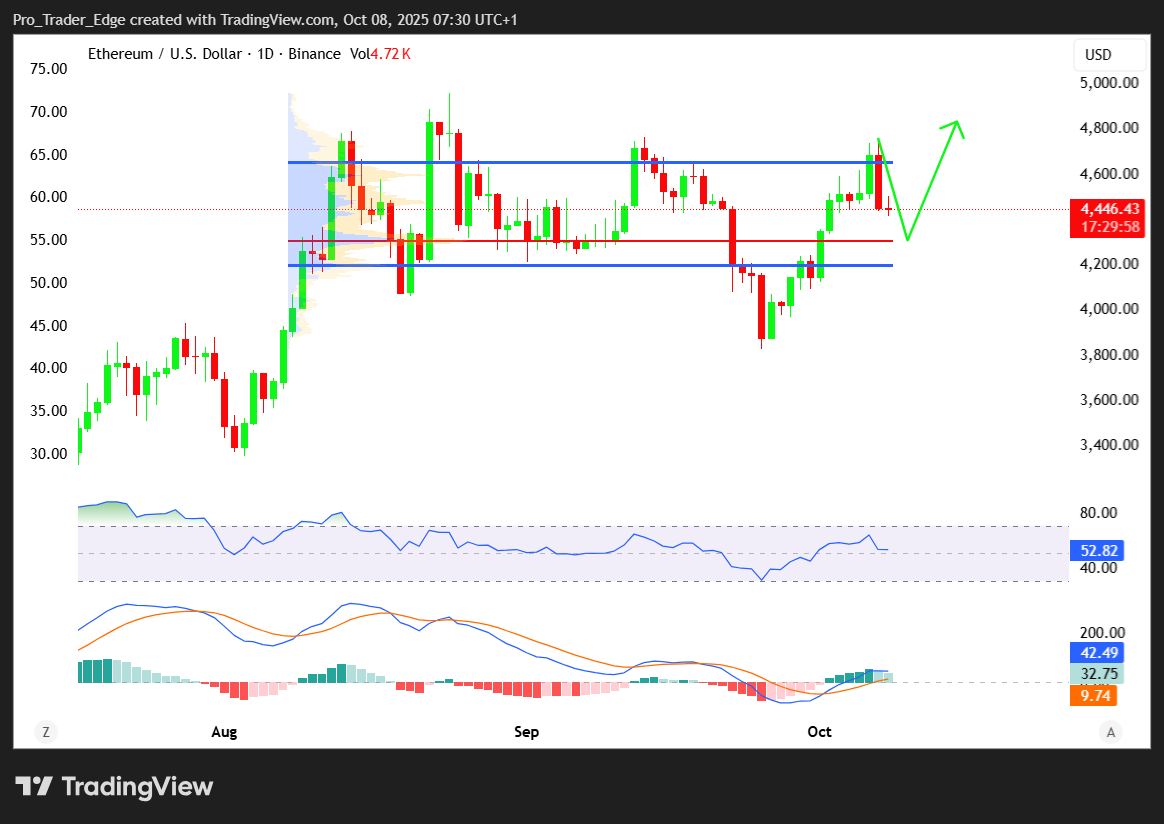
- Critical support zone at $4,400-$4,420 will determine next price move
- Futures traders remain active while spot market shows selling pressure
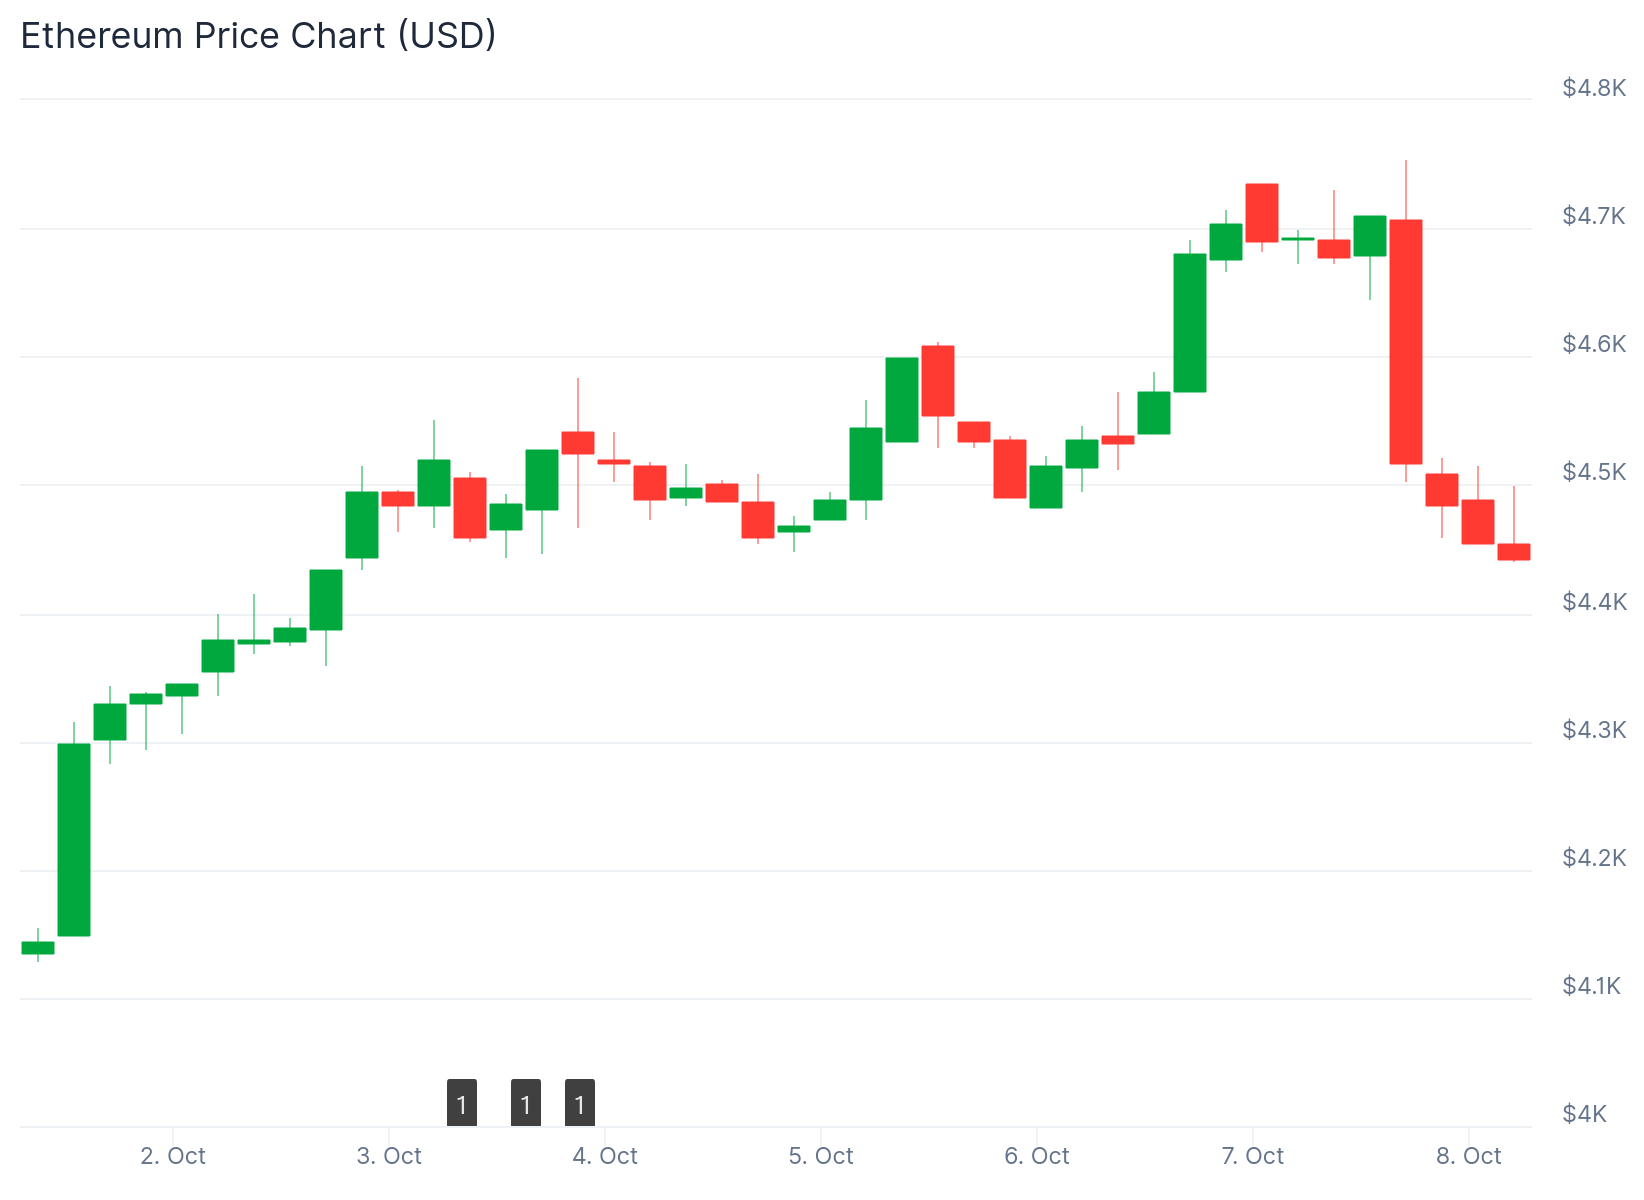
Ethereum price action stalled this week as the cryptocurrency failed to break through the $4,800 resistance level. The rally lost steam on Tuesday, resulting in a 3% correction that pushed prices below the $4,500 mark.
The decline followed a bearish divergence pattern on the four-hour chart. This technical signal typically indicates weakening buying pressure. While Bitcoin reached new all-time highs on Monday, Ethereum could not maintain its upward momentum.
ETH peaked at $4,759 before bears seized control. The price fell through multiple support levels including $4,620 and $4,600. A key bullish trend line at $4,560 was also broken during the selloff.
Market data reveals conflicting signals across different trading venues. Spot cumulative volume delta dropped sharply, showing net selling pressure from spot traders. However, futures open interest and futures CVD remained elevated throughout the correction.
This divergence suggests leveraged traders are still positioning for future volatility. The active futures market indicates expectations for continued price movement despite the current pullback.
Ethereum now trades below the $4,550 level and the 100-hourly Simple Moving Average. The price touched $4,440 before entering a consolidation phase.

Support and Resistance Levels to Watch
The $4,400 to $4,420 range represents a crucial support zone for Ethereum. This area typically contains clustered stop orders. A strong bounce from this level could cancel the bearish setup and restart upward momentum.
Failure to defend this support could extend the correction to $4,250 or $4,100. These price points align with four-hour and one-day order blocks where significant buying interest previously emerged.
Resistance levels sit at $4,520 and $4,550 on the upside. The primary resistance barrier stands at $4,600. Breaking above this level could propel Ethereum toward $4,650.
Further gains beyond $4,650 might target $4,720 or $4,750. Each resistance level represents a potential barrier to continued upward movement.
Supply Dynamics Favor Long-Term Bulls
Exchange reserves dropped to approximately 16.1 million ETH. This marks a decline exceeding 25% since 2022. The consistent downward trend reflects decreasing sell-side pressure across major exchanges.

Net exchange flows continue moving negative. Ethereum is flowing into self-custody wallets and staking contracts. This movement reduces the available supply for trading on exchanges.
The US M2 money supply reached $22.2 trillion according to XWIN Research. Bitcoin gained over 130% since 2022 responding to increased liquidity. Ethereum has only risen 15% during the same period.
One market observer noted this represents the fourth test of the $4,700-$4,800 resistance zone. Successfully holding above this area would provide a bullish signal for future price action.
Technical indicators show mixed momentum. The hourly MACD is losing strength in the bullish zone. The hourly RSI dropped below 50, suggesting short-term weakness.
The current price action around $4,440 to $4,520 will likely determine Ethereum’s direction for the coming days. A rebound from current levels could reset the chart for another attempt at breaking $4,800 resistance.
Get 3 Free Stock Ebooks
Discover top-performing stocks in AI, Crypto, and Technology with expert analysis.
- Top 10 AI Stocks - Leading AI companies
- Top 10 Crypto Stocks - Blockchain leaders
- Top 10 Tech Stocks - Tech giants

