
 Price: Can $3,800 Support Hold After Whale’s Buy $183M?")
TLDR
- ETH is currently priced at $3,848 with a market cap of $465.38 billion and 24-hour volume of $54.12 billion
- Bitmine’s $183.93 million ETH purchase signals institutional interest but hasn’t triggered a breakout yet
- Price failed to hold above resistance and pulled back to test the $3,800 support zone
- RSI dropped from 64.56 to 53.04 while MACD turned bearish, indicating weakening buyer momentum
- Breaking below $3,800 could send ETH toward $3,400-$3,600, while holding may enable recovery toward $4,000
Ethereum is trading at $3,848 after declining 0.55% in the past 24 hours. The second-largest cryptocurrency by market cap holds a valuation of $465.38 billion.
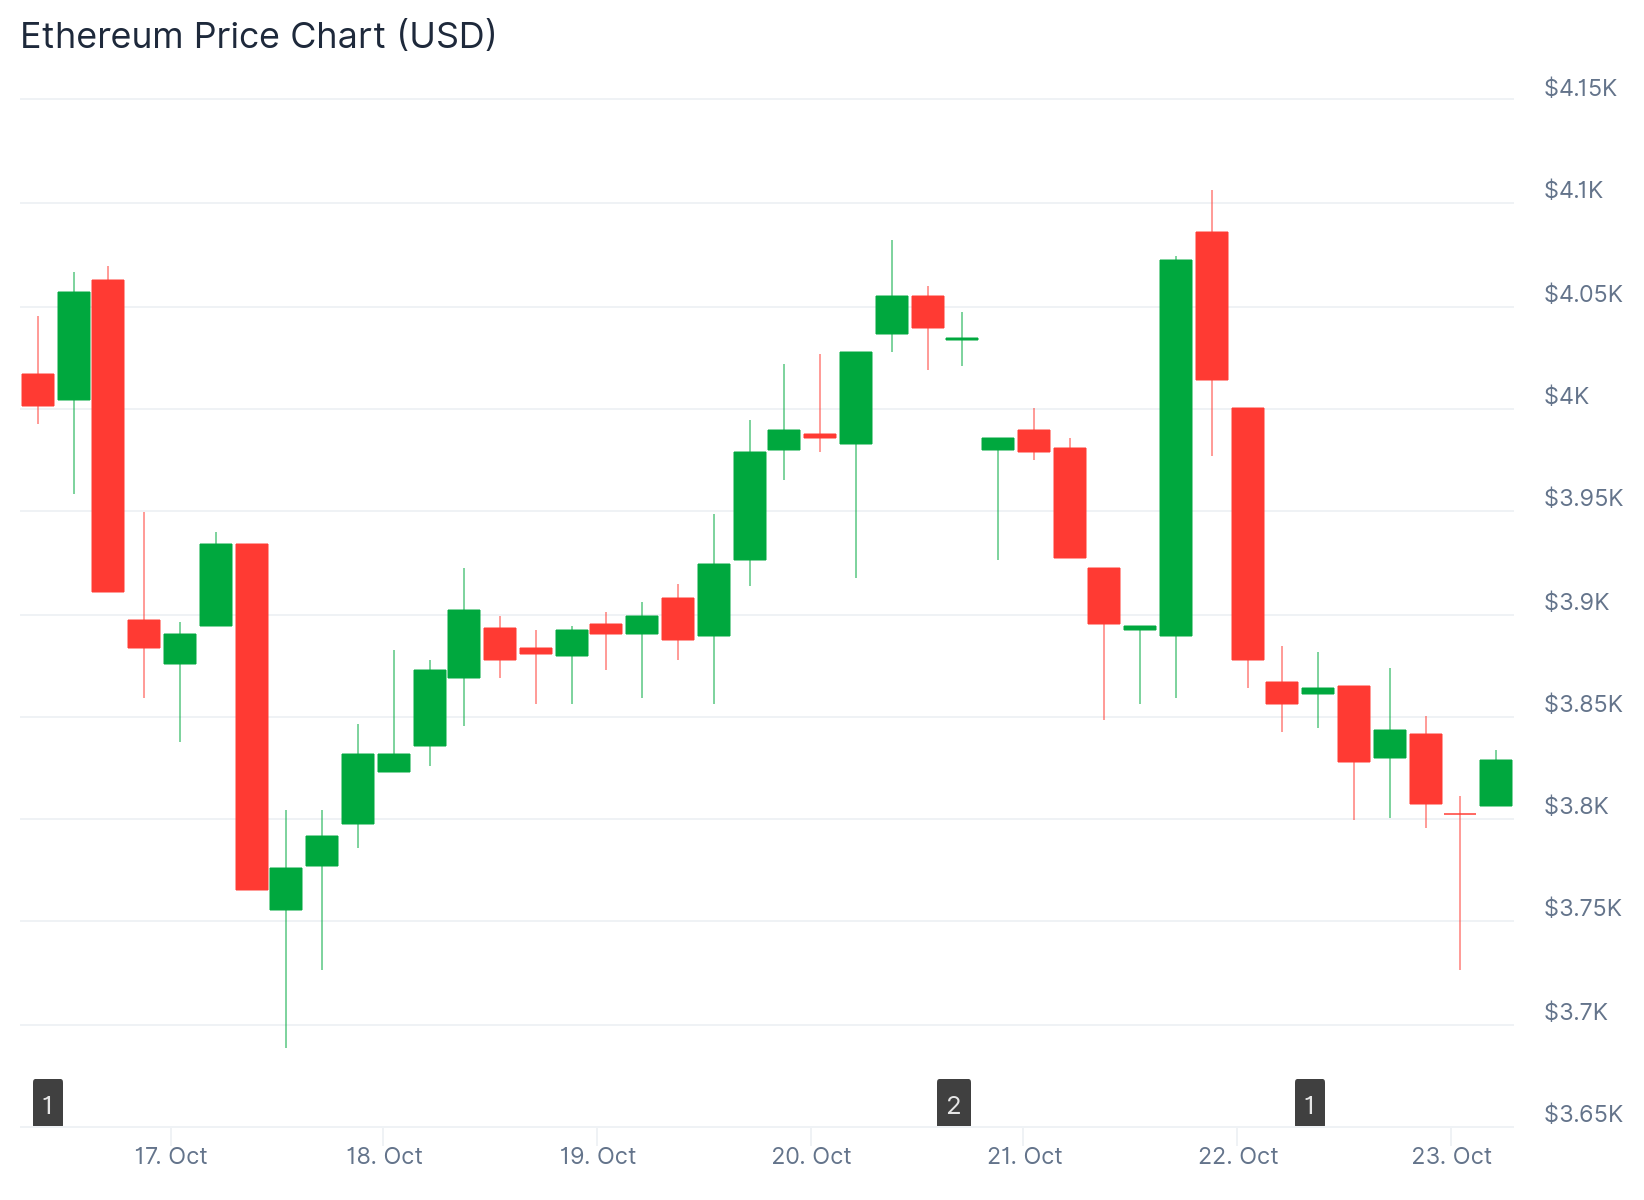
Trading volume reached $54.12 billion over the last day. This shows continued activity despite downward price pressure.
The $3,800 level is now under scrutiny. This price point represents a crucial support zone that could determine ETH’s next directional move.
Whale Activity Fails to Spark Rally
Bitmine purchased $183.93 million worth of Ethereum tokens in a single transaction. Crypto analyst Ted shared blockchain data confirming the buy.
According to Ted, multiple purchases of this magnitude could provide the catalyst needed for an upward move. However, the market has not responded with immediate gains.
Institutional buying typically signals confidence in an asset. Yet buyers have been unable to push ETH past key resistance levels.

Ethereum recently retested a major resistance area but could not break through. The price attempted to hold above this zone but failed.
After the rejection, ETH retreated to the $3,800 region. This area must now act as a floor to prevent further declines.
If support holds, Ethereum could mount another attempt at higher prices. A breakdown below $3,800 could send the token toward the $3,400-$3,600 range.
Technical Setup Shows Bearish Signals
Ethereum started a recovery from $3,700 earlier this week. The price climbed above $3,750 and $3,800 briefly.
ETH cleared the 23.6% Fibonacci retracement level from its recent decline. However, bears blocked further progress near $3,840.
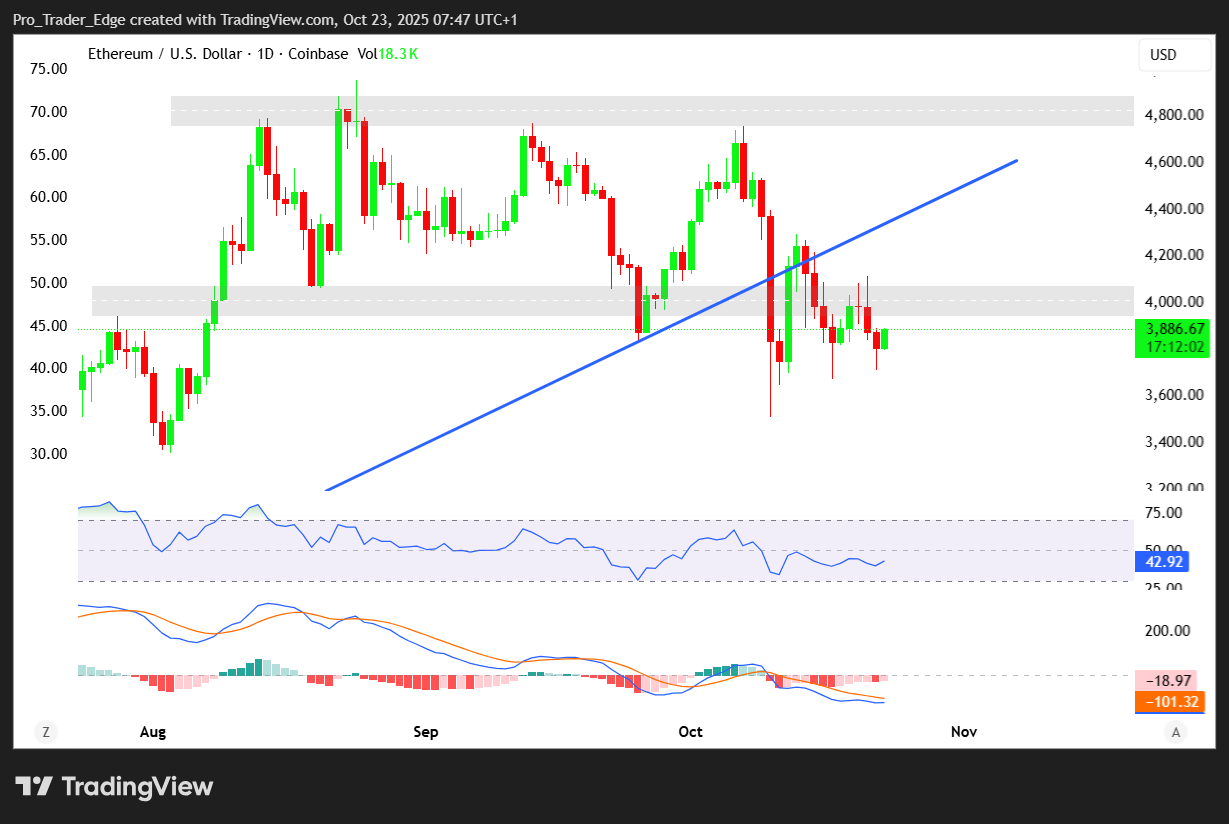
The price now trades below $3,850 and the 100-hour Simple Moving Average. A short-term bearish trend line has formed with resistance at $3,850.
The next resistance sits at $3,920, representing the 50% Fibonacci retracement level. Major resistance is located at $3,950.
Breaking above $3,950 would open the door to $4,020. Further gains could push Ethereum toward $4,120 or $4,150.
The RSI indicator stands at 53.04, down from 64.56 on the weekly chart. This decline suggests buying pressure is fading.
Sideways consolidation appears likely unless momentum shifts. The Moving Average Ribbon provides support near $3,793 and $3,013.
The MACD indicator crossed bearish. The blue line dropped below the signal line at 386.42 compared to 436.26.
The histogram turned negative at -49.83. This confirms weakening bullish momentum.
Bears may maintain control unless ETH recovers above $4,000 soon. The hourly MACD is losing steam in bearish territory.
The hourly RSI fell below 50. This indicates sellers are gaining the upper hand.
Support Levels to Watch
If Ethereum cannot clear $3,850 resistance, another decline may begin. The first support level sits at $3,800.
Major support is located at $3,740. A break below this level could push ETH toward $3,700.
Additional losses might bring $3,650 or $3,620 into play. The next few sessions will be critical for determining ETH’s direction.
Market participants are monitoring whether $3,800 can provide a launchpad for recovery. The combination of whale buying and technical weakness creates an uncertain outlook for Ethereum in the near term.
Get 3 Free Stock Ebooks
Discover top-performing stocks in AI, Crypto, and Technology with expert analysis.
- Top 10 AI Stocks - Leading AI companies
- Top 10 Crypto Stocks - Blockchain leaders
- Top 10 Tech Stocks - Tech giants

