
 Price: Rallies 18% From $170 Low – Time To Buy?")
TLDR
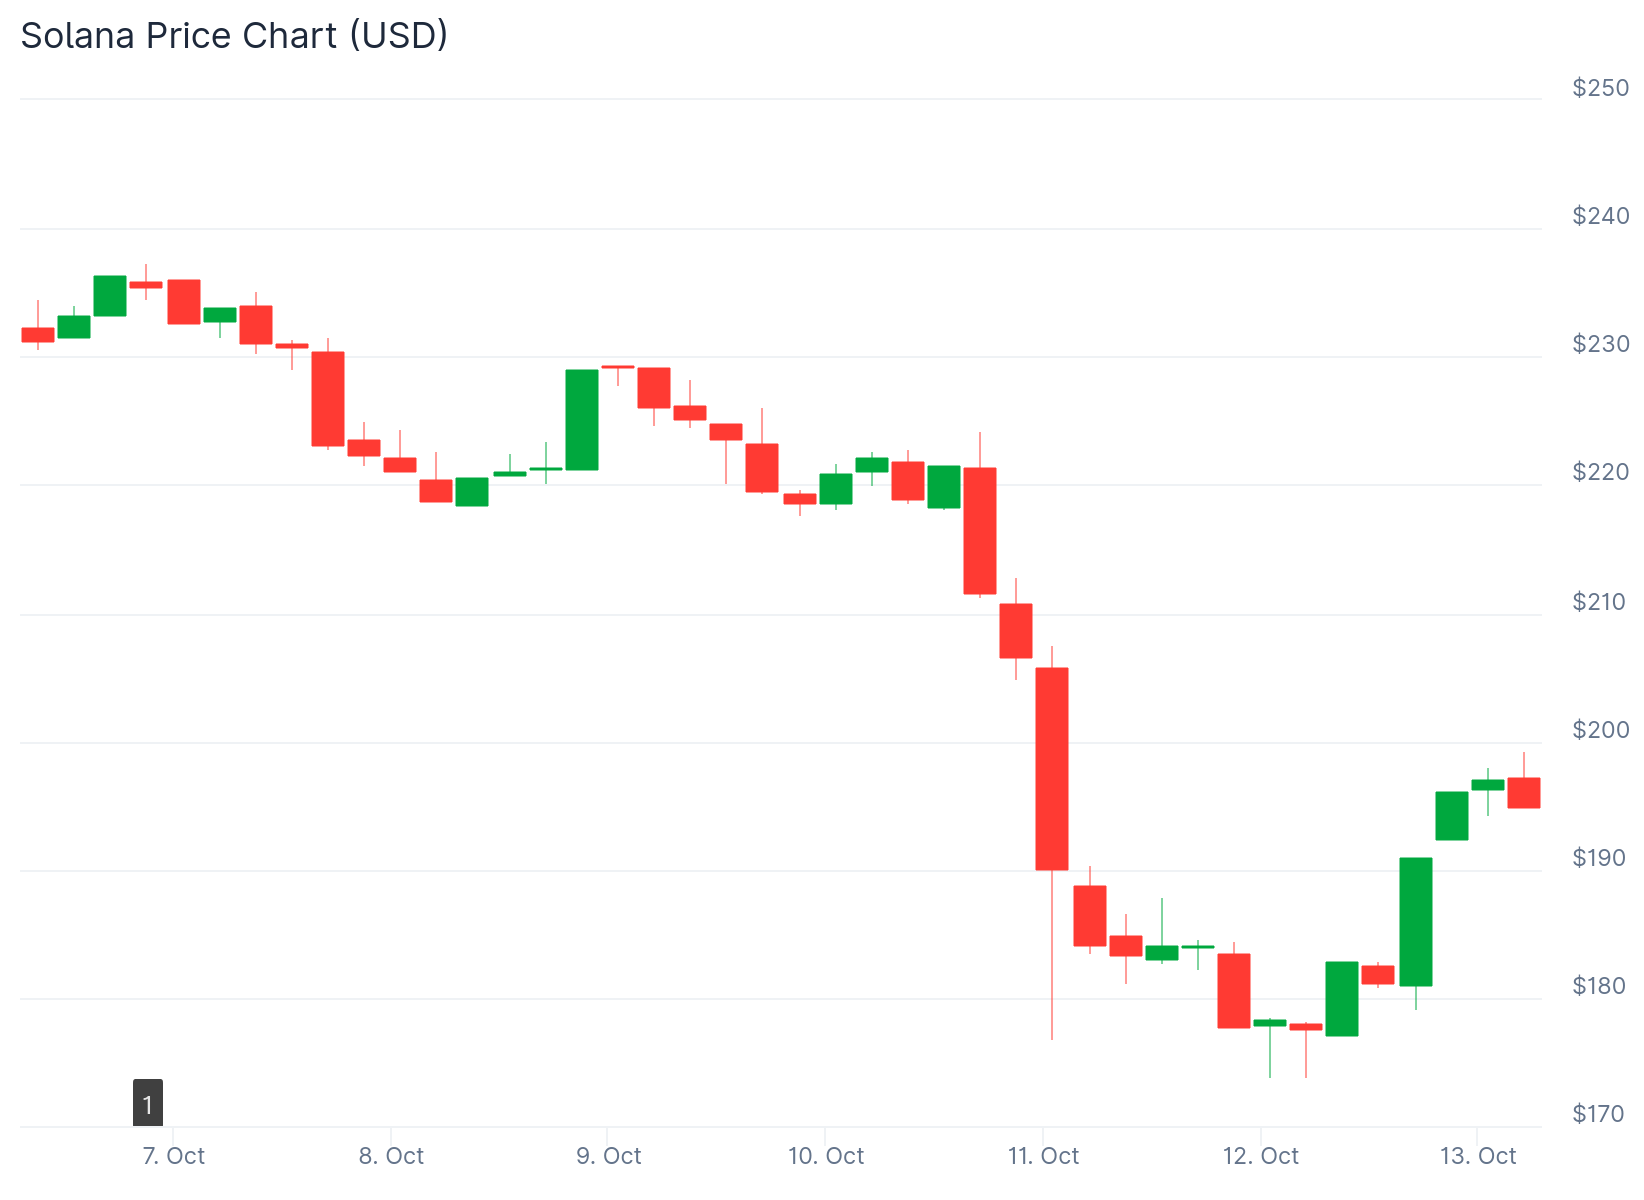
- Solana (SOL) climbed 5.33% to $192.56 in 24 hours but trading volume plunged 38.49% to $11.19 billion.
- Weekly performance shows a 15.95% decline, creating uncertainty about whether the recent bounce will hold.
- Analysts warn SOL could drop to $150-$160 if it fails to reclaim the $195 support level.
- Technical indicators RSI and MACD suggest a potential bullish reversal with SOL crossing above key moving averages.
- Open Interest jumped 7.06% to $10.14 billion while volume decreased, showing mixed sentiment among traders.
Solana price jumped 5.33% over the last 24 hours to trade at $192.56. The daily gain provided relief after recent losses.
Trading volume tells a different story. Activity dropped 38.49% to $11.19 billion during the same period.
The decline in volume raises questions about the strength of the recovery. Lower participation often indicates weak conviction among traders.
The past week shows deeper problems for Solana. SOL price fell 15.95% over seven days.
This weekly drop overshadows the recent daily gains. The cryptocurrency has not fully recovered from its broader decline.
Critical Support Levels Under Pressure
Crypto analyst BitMonty identified a key problem for Solana. The price broke below the important $195 support level.

This breakdown indicates weakness in the near term. Without a recovery above $195, SOL could face further declines.
The next major support zone sits between $150 and $160. If Solana reaches this area, a reversal could push prices toward $220 or $240.
But the cryptocurrency needs to stabilize first. Continued weakness could accelerate the decline.
Analyst GemXBT noted a positive development. Solana crossed above its 5, 10, and 20-hour moving averages.
This pattern typically signals the beginning of bullish momentum. The crossover suggests buyers are gaining control in the short term.
Technical Indicators Point to Possible Reversal
The Relative Strength Index moved out of oversold conditions. This shift creates room for upward price movement.
The MACD indicator recorded a bullish crossover with rising volume. This combination strengthens the case for a potential uptrend.
These technical signals suggest Solana could enter a recovery phase. However, the falling volume creates doubt about sustainability.
Data from CoinGlass reveals conflicting metrics. Trading volume decreased 32.87% to $31.75 billion.
Meanwhile, Open Interest increased 7.06% to $10.14 billion. More positions opened despite fewer active trades.
The OI-Weighted Funding Rate stands at -0.0430%. This negative rate indicates slight bearish sentiment in futures markets.
Solana began its recent recovery from support near $155. The price climbed past $172 and broke through $180.
Bulls pushed SOL above the 50% Fibonacci retracement level. A bullish trend line formed with support at $188.
The cryptocurrency now faces resistance near $198. The next major barrier appears at $200.
Key Levels to Watch
A break above $200 opens the door to $205 and $212. Further gains could target $220.
On the downside, support exists at $190 and the trend line. Major support sits at $182.
A drop below $182 could send Solana toward $175. Breaking that level might push the price to $160.
The hourly MACD continues gaining strength in bullish territory. The RSI remains above 50, showing positive momentum.
Solana price action remains uncertain despite the daily recovery. The combination of falling volume and mixed technical signals creates a challenging environment for traders.
Get 3 Free Stock Ebooks
Discover top-performing stocks in AI, Crypto, and Technology with expert analysis.
- Top 10 AI Stocks - Leading AI companies
- Top 10 Crypto Stocks - Blockchain leaders
- Top 10 Tech Stocks - Tech giants

