
 Price: Tether Brings $175B Liquidity as First ETF Launches")
TLDR
- Tether integrated USDt and Tether Gold onto Solana via Legacy Mesh, unlocking $175 billion in cross-chain liquidity for users
- Solana generates $4.83 million in daily app revenue, outperforming Ethereum, Binance Smart Chain, and other major blockchains
- SOL trades near $189 with analyst Ali Martinez targeting a potential move to $260
- Hong Kong approved the first Solana spot ETF while 21Shares filed Form 8-A with the SEC
- Price tests critical $190 support level with breakout potential above $211 or downside risk to $170
Tether expanded its stablecoin ecosystem to Solana through the Legacy Mesh interoperability framework. The integration brings USDt and Tether Gold to the network, providing access to $175 billion in cross-chain liquidity.
The USDT0 bridge already processed over $25 billion in volume across twelve chains. Solana users can now access this liquidity for decentralized applications, payments, treasury management, remittances, and collateralized lending.
Bitwise Chief Investment Officer Matt Hougan believes Solana could become the preferred blockchain for banks conducting stablecoin transactions. The Tether integration strengthens this case alongside protocols like Splyce and Chintai that enable tokenized securities trading on Solana.
App Revenue Dominance
Solana leads all blockchains in daily app revenue with $4.83 million over the past 24 hours. Binance Smart Chain follows at $3.85 million, while Ethereum generated $2.7 million during the same period.
Hyperliquid L1 reached $2.97 million, with Base, edgeX, Arbitrum, and Polygon trailing behind. The revenue data demonstrates strong network activity and transaction demand compared to competing blockchains.
Community members interpret this performance as a positive signal for Solana’s market position. Consistent app revenue could support price recovery if trading volumes increase in coming weeks.

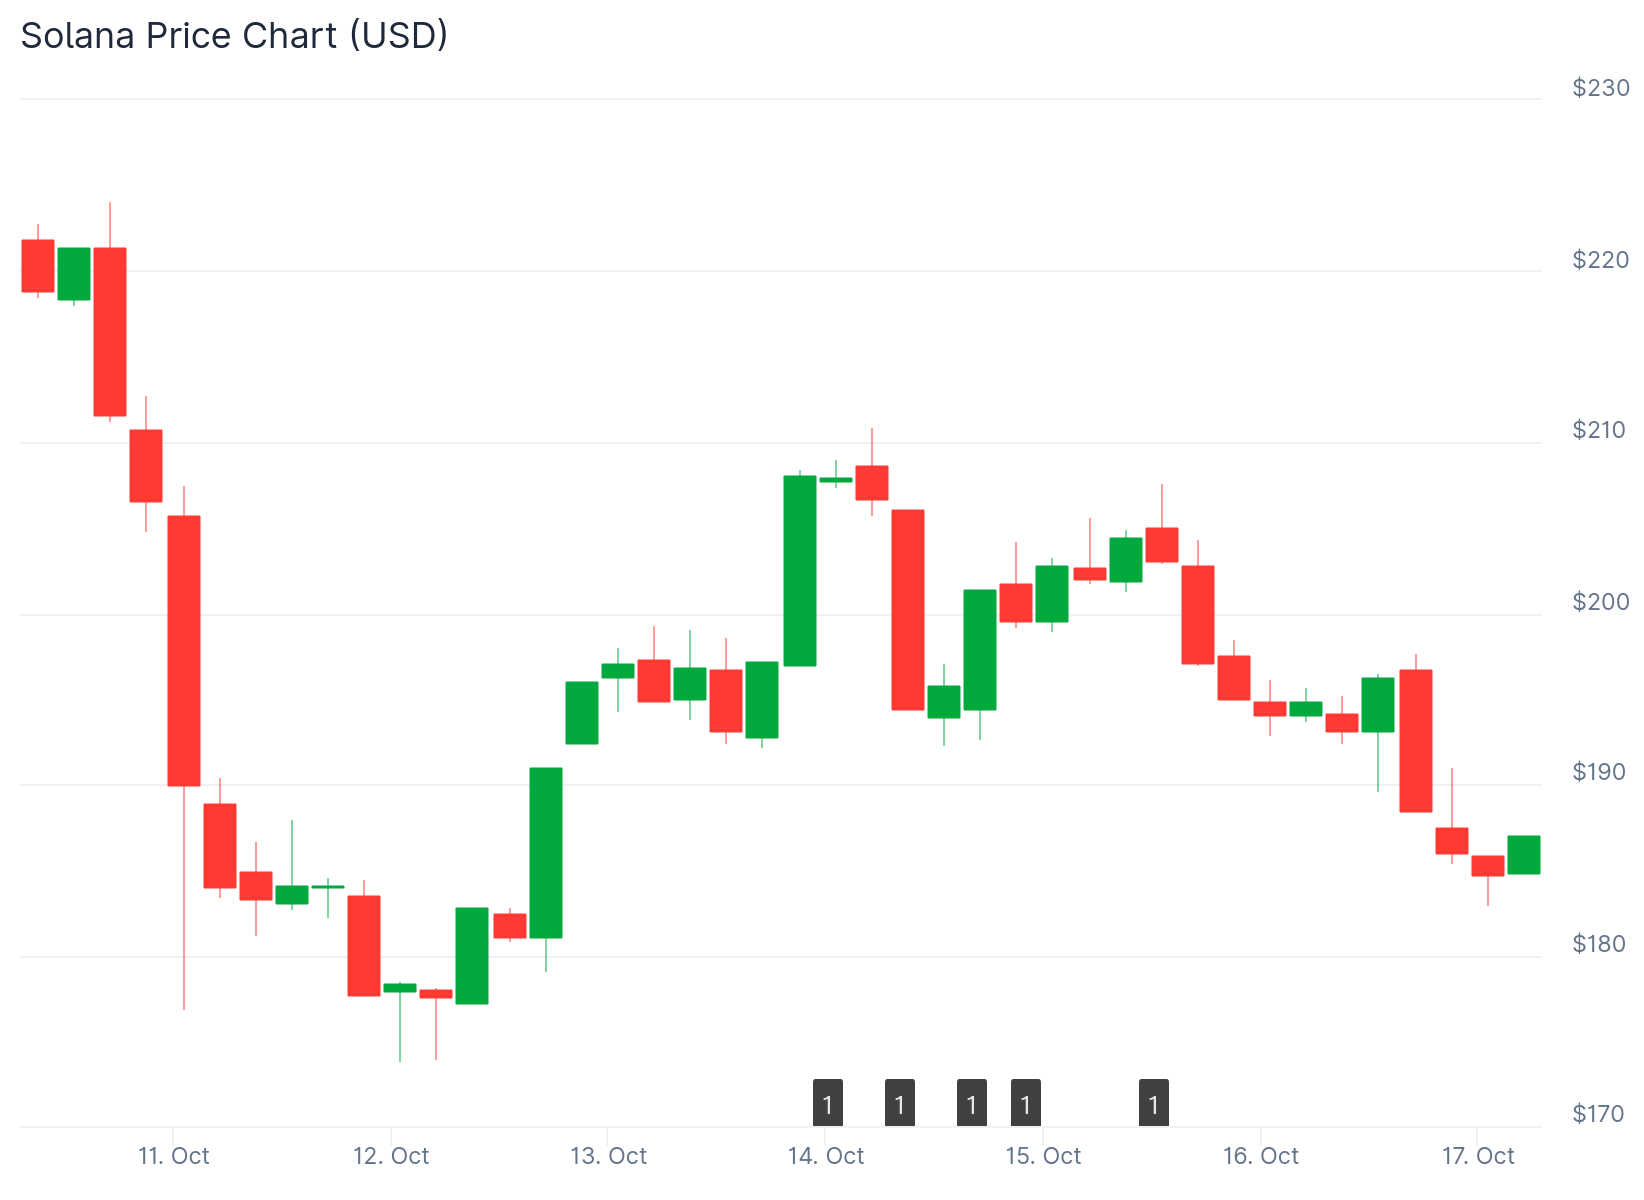
SOL currently trades at $189.45. Analyst Ali Martinez predicts the price could retest $260 based on current market structure.
Technical Outlook and Key Levels
The cryptocurrency tests support around $180-190, a level maintained since late August. The 20-day moving average crossed below the 50-day moving average on the daily chart.
This pattern can signal short-term weakness according to market observers. A break below $190 could push Solana down to $170, the support level tested last week.
A clear move above $211 would reverse the trend and open a path toward higher prices. Breaking through $300, the previous all-time high, could initiate price discovery with targets at $500 or beyond.
The RSI trends back toward the neutral line while the MACD histogram converges on the signal line. These indicators suggest building buy pressure according to some technical analysts.
ETF Progress Fuels Optimism
Hong Kong launched the world’s first Solana spot ETF. Asset manager 21Shares simultaneously filed Form 8-A with the U.S. Securities and Exchange Commission, advancing its Solana ETF application.
These separate developments reflect growing institutional interest in the blockchain. ETF products could attract new capital by offering traditional investors easier access to digital assets.
Market participants expect approved ETFs to increase liquidity and market attention for Solana. Traders view this as potential support for long-term demand.
Solana consolidated in a range for seven months, forming an ascending channel pattern. Current price action at the $190 support level will determine whether SOL breaks out or continues ranging.
The network maintains strong fundamentals with top app revenue performance and expanding institutional infrastructure through stablecoin integration and ETF products.
Get 3 Free Stock Ebooks
Discover top-performing stocks in AI, Crypto, and Technology with expert analysis.
- Top 10 AI Stocks - Leading AI companies
- Top 10 Crypto Stocks - Blockchain leaders
- Top 10 Tech Stocks - Tech giants

