

Key Takeaways
- Ripple is hovering around the $1.40–$1.41 range, trapped between $1.35 support and $1.50 resistance levels.
- Daily capital inflows into XRP investment vehicles reached $13.74 million, bringing total net inflows to $1.27 billion.
- The 30-day Realized Volatility Index has dropped to 0.42, the lowest reading in multiple years—typically signaling an incoming major price shift.
- The digital asset continues trading beneath its 50-day, 100-day, and 200-day moving averages, which are all pointing downward.
- Technical analyst Ali Charts identified a symmetrical triangle formation suggesting an upcoming 35% price swing.
Ripple’s XRP has remained anchored near the $1.40–$1.41 price point, locked within a narrow trading corridor that has left both optimistic and pessimistic traders waiting for direction. The cryptocurrency has posted approximately 8% gains over the previous week, buoyed by positive sentiment across digital asset markets. However, it continues struggling to establish a foothold above the critical $1.50 threshold.
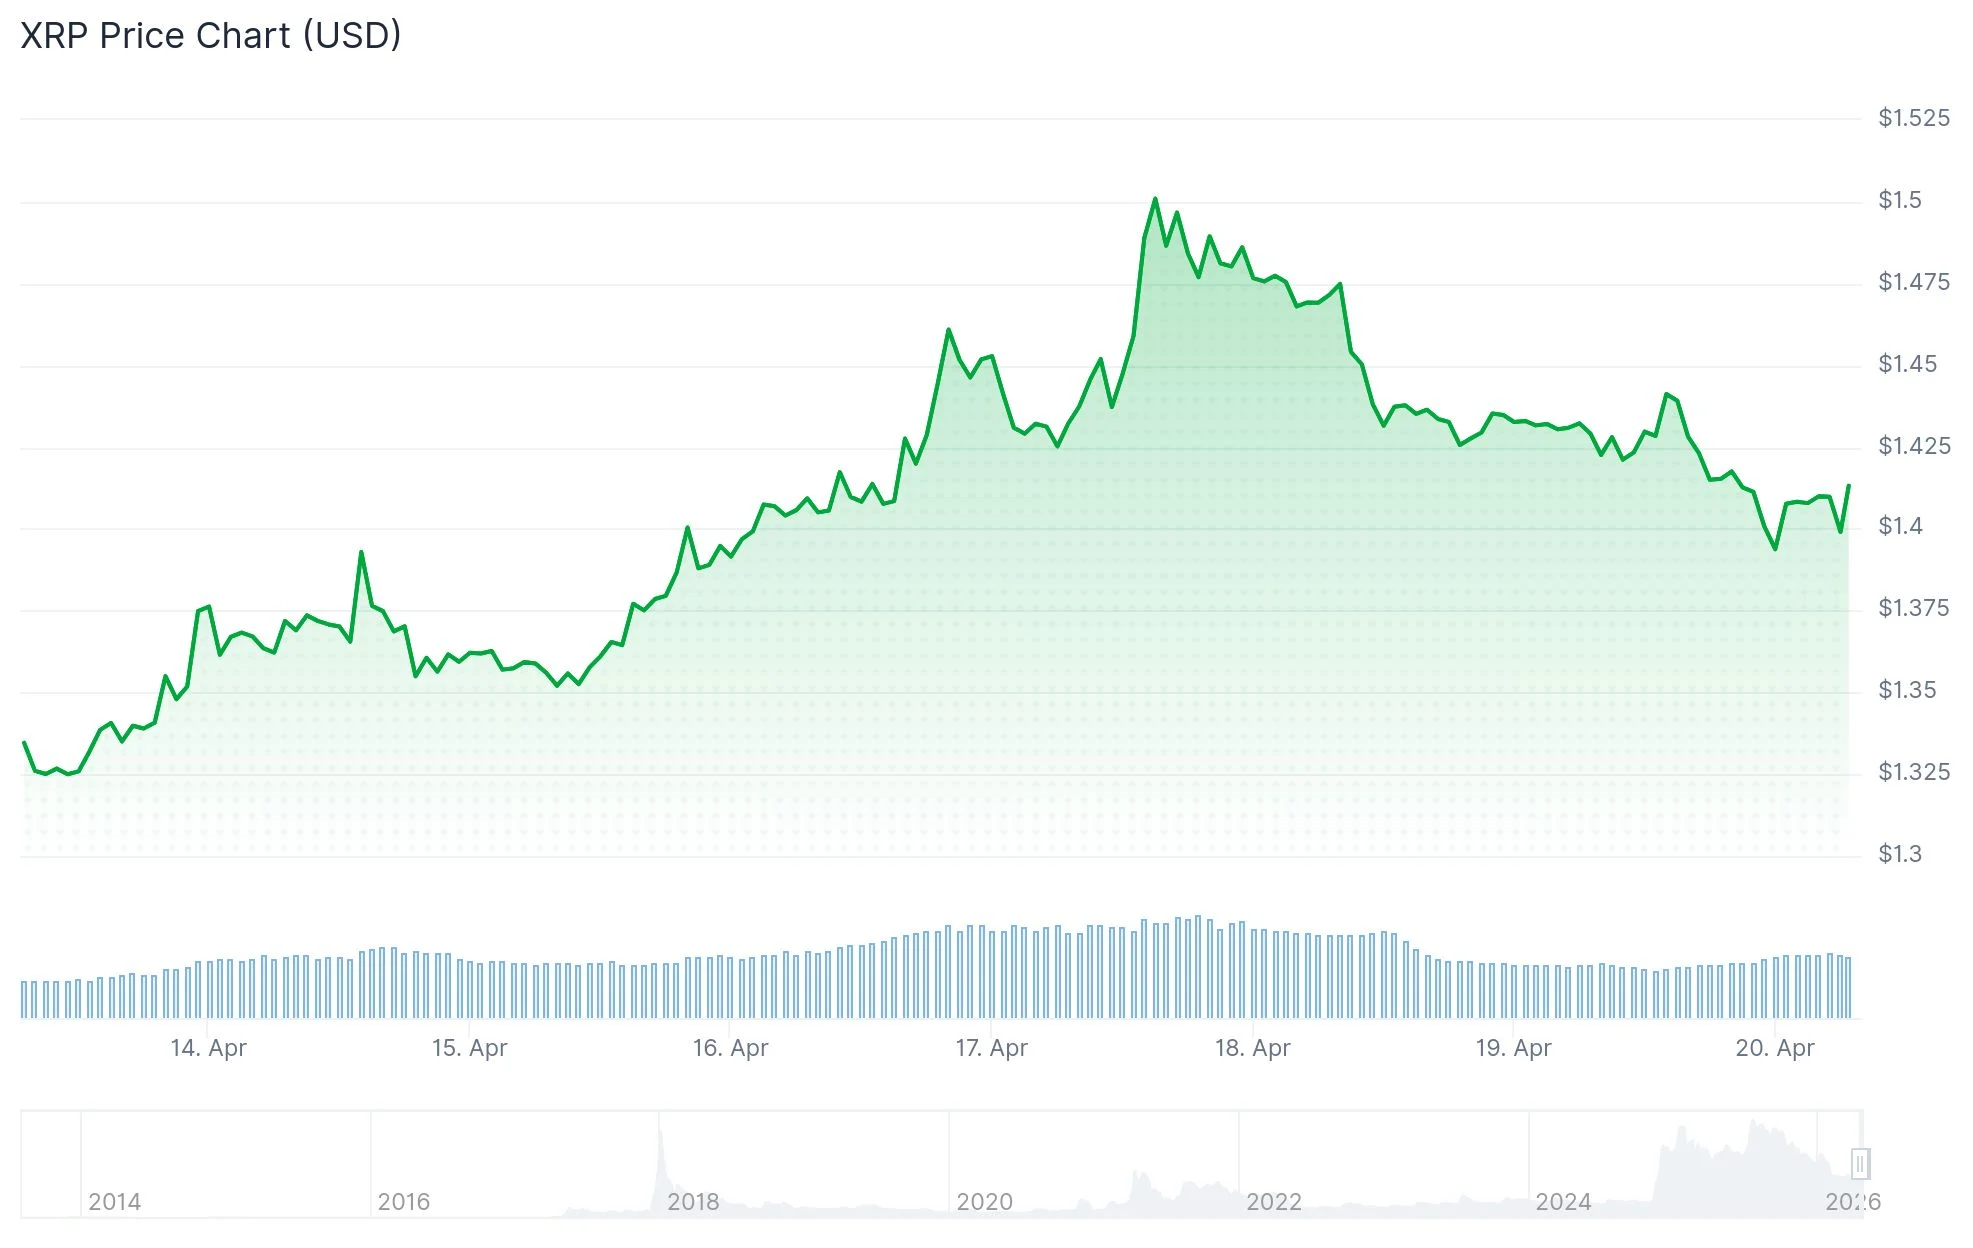
The $1.50 price level has functioned as a persistent barrier over recent weeks. Market participants who accumulated positions at lower price points seem to be offloading holdings when price approaches this zone, generating selling pressure that stalls upward momentum.
From a macroeconomic perspective, market participants are closely monitoring the Federal Reserve’s scheduled April 28 policy announcement. Any indications regarding interest rate direction could substantially influence sentiment throughout cryptocurrency markets, including XRP’s trajectory.
Concurrently, Bitcoin surged past $77,000 while Ethereum broke through $2,300, triggering renewed buying interest across the wider digital asset ecosystem. Alternative cryptocurrencies including Solana, Cardano, and Dogecoin similarly recorded modest appreciation during this timeframe.
Capital Flows Maintain Positive Momentum
Investment products focused on XRP continue drawing significant capital. Daily inflows registered at $13.74 million, elevating aggregate net inflows to $1.27 billion. This sustained accumulation indicates continued institutional appetite for exposure to the asset.

U.S.-based spot Bitcoin exchange-traded funds absorbed $664 million during a single trading session, representing the fourth consecutive day of positive capital movement. Spot Ethereum ETFs attracted $127 million, maintaining their seven-day streak of inflows.
Technical Analysis Reveals Key Patterns
From a technical standpoint, XRP is operating within clearly defined boundaries. Daily charting reveals support maintaining stability around $1.35 while resistance continues capping rallies at $1.50. The MACD indicator is gradually trending upward, and histogram bars are contracting, suggesting declining bearish pressure.
The Relative Strength Index currently registers near 54, reflecting neutral territory. Neither buying nor selling forces are demonstrating clear dominance at present.
Cryptocurrency analyst Ali Charts highlighted on X that XRP is developing a symmetrical triangle formation, a technical pattern that historically precedes substantial directional price movements. According to Ali Charts, this configuration indicates a potential 35% price swing, though the breakout direction remains uncertain.
Examining longer timeframes reveals a more cautious outlook. XRP reached a peak above $3.00 during mid-2025 before entering a sustained decline characterized by consecutive lower highs and lower lows. A significant volume-driven selloff in early February 2026 eliminated leveraged positions and reset market structure, though price action has remained largely stagnant since.
XRP’s 30-day Realized Volatility Index has contracted to approximately 0.42, representing the lowest measurement since 2024. Historical precedent suggests such extreme compression typically precedes significant price movements rather than prolonged consolidation.
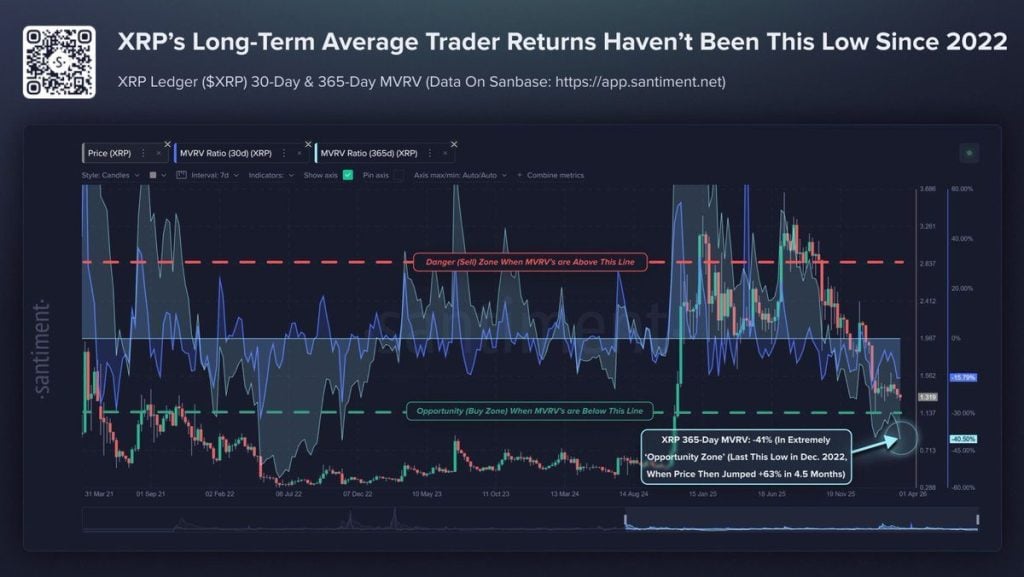
Blockchain metrics indicate the majority of holders remain at unrealized losses. The MVRV ratio currently sits at levels observed during previous periods of market distress, while the percentage of supply showing profits remains depressed. XRP has declined roughly 30% over the trailing twelve months.
The critical price level requiring attention is $1.50. A decisive breakout and sustained hold above this marker would represent the first definitive indication of trend reversal. Should support at $1.30 fail, limited structural support exists below that threshold.
Get 3 Free Stock Ebooks
Discover top-performing stocks in AI, Crypto, and Technology with expert analysis.
- Top 10 AI Stocks - Leading AI companies
- Top 10 Crypto Stocks - Blockchain leaders
- Top 10 Tech Stocks - Tech giants

