
 Bulls Eye $85K as Whales Accumulate 240,000 BTC Amid Fed Week")
Key Highlights
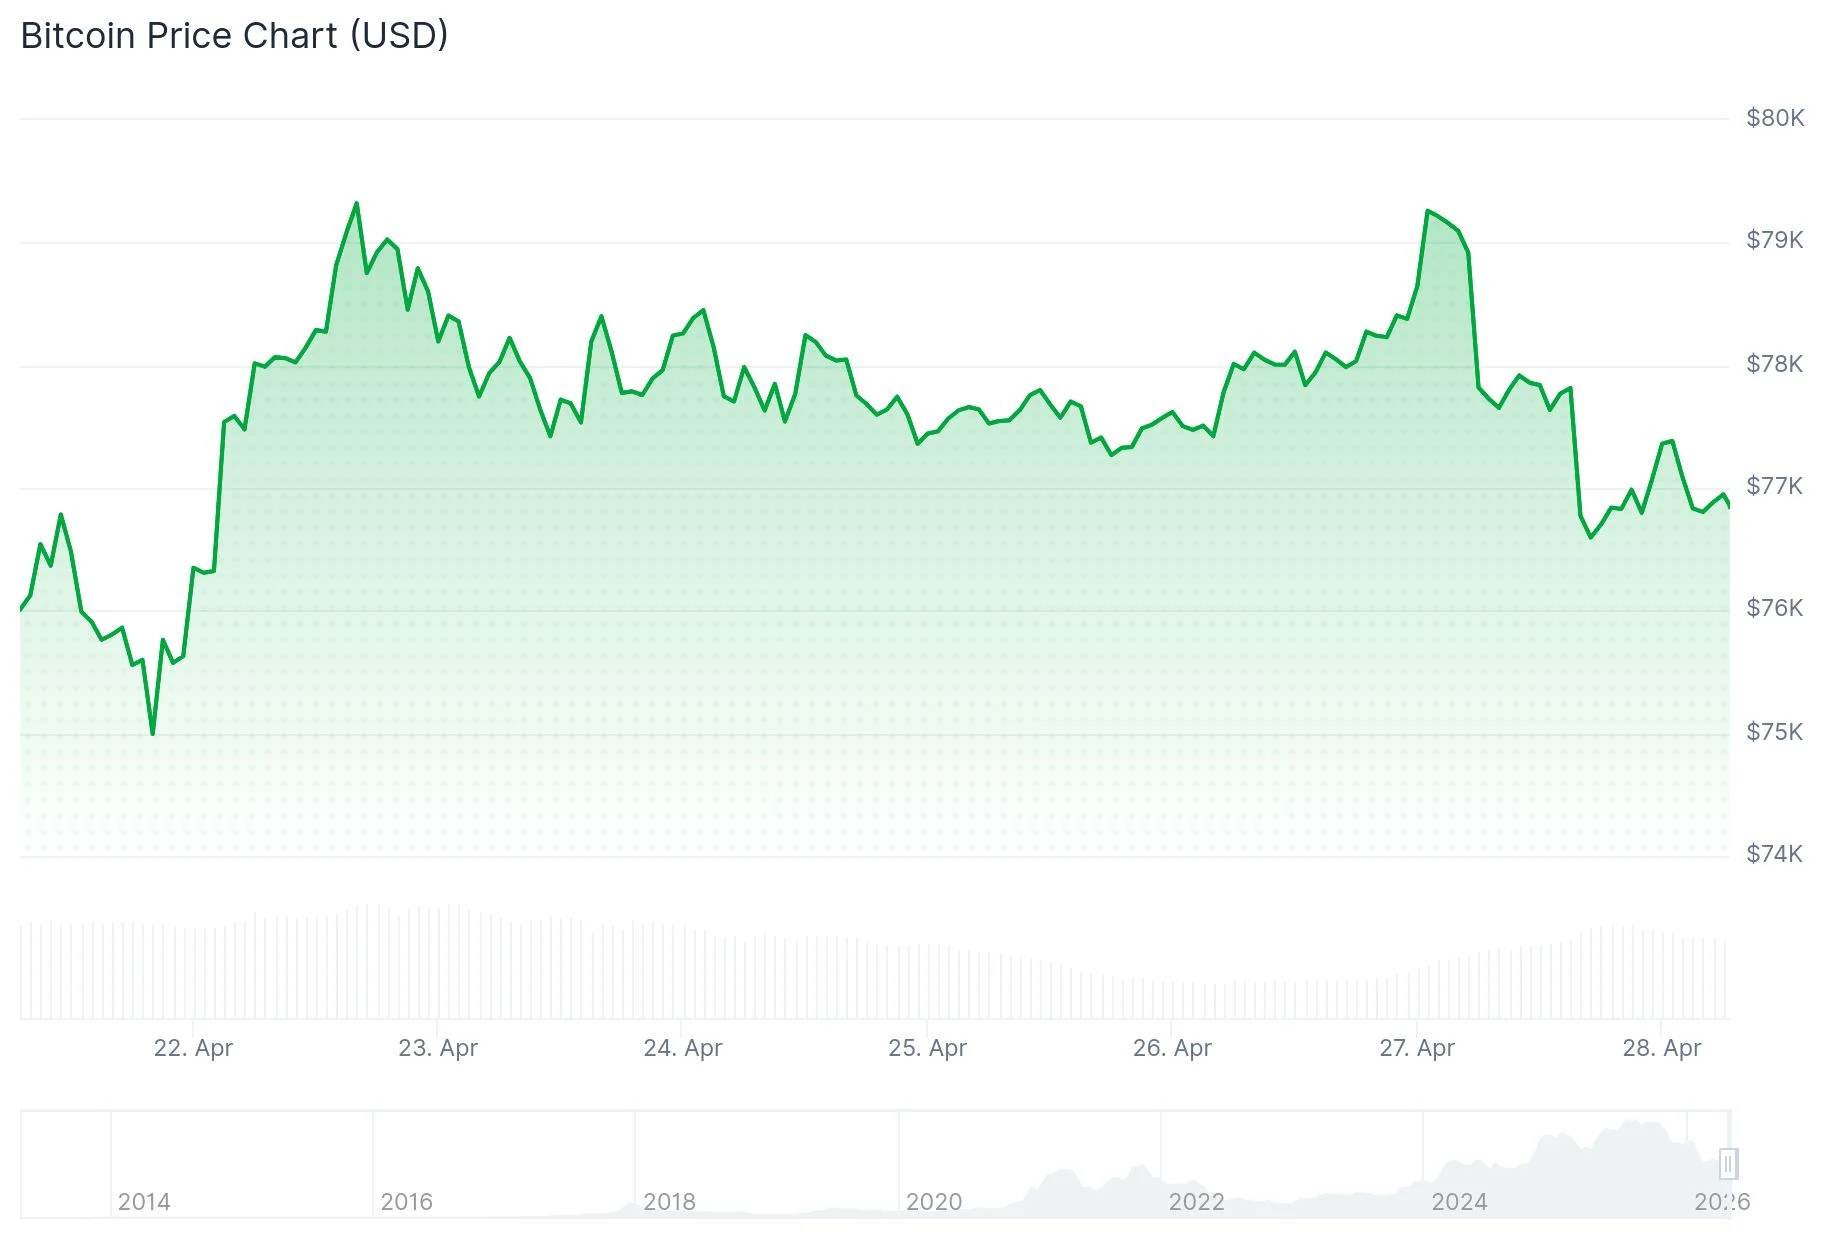
- BTC consolidates around $77,000 with a 3% decline as markets await critical U.S. economic indicators and Federal Reserve policy announcement
- Crude oil maintaining levels above $100 per barrel intensifies inflation concerns, diminishing prospects for immediate Federal Reserve rate reductions
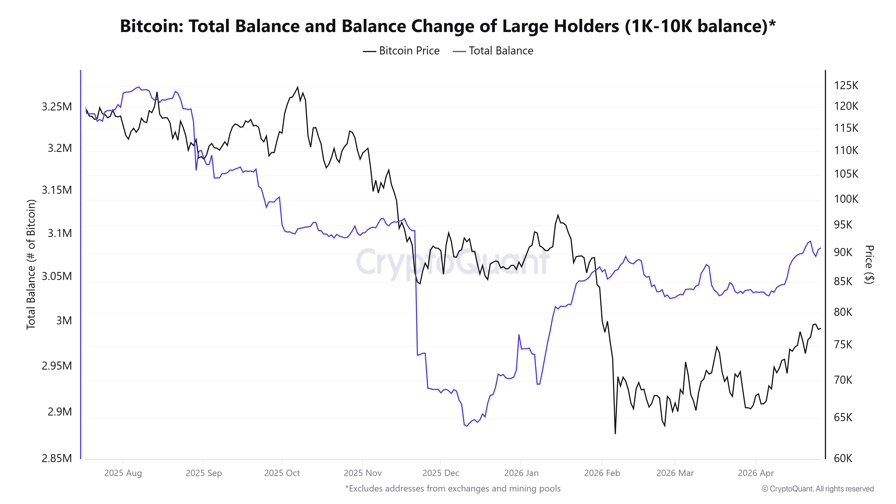
- Major Bitcoin holders controlling 1,000–10,000 BTC have added approximately 240,000 BTC to their portfolios since December, marking a five-month peak
- Emerging signs of weakening AI sector demand, highlighted by OpenAI’s revenue shortfall, may decrease Bitcoin selling pressure from mining operations
- Market strategists project near-term downside risk toward $73,700 liquidity zone, while maintaining bullish targets between $85,000–$88,000 for May
Bitcoin currently hovers around the $77,000 level, registering approximately a 3% decline during Asian trading sessions. The pullback appears driven by widespread caution as participants brace for a critical week of macroeconomic data releases rather than any fundamental deterioration in crypto market dynamics.
Singapore-based trading firm Enflux noted that market participants are adopting a wait-and-see approach before Wednesday’s Federal Reserve policy announcement. This week’s calendar features several high-impact releases including Gross Domestic Product figures, Personal Consumption Expenditures inflation metrics, and the Employment Cost Index.
Elevated crude oil valuations continue to pose the most significant challenge. With Brent crude sustained above the $100 threshold, inflationary pressures persist, complicating the Federal Reserve’s ability to pivot toward monetary easing.
Polymarket prediction markets currently assign a 95% probability that the June FOMC meeting will maintain current interest rates unchanged. This environment has generated hesitation across risk-sensitive assets, with cryptocurrencies experiencing notable impact.
Bitcoin currently trades approximately 4% beneath the short-term holder cost basis situated around $80,700. This metric frequently serves as an indicator of purchasing confidence among recent market entrants.

Enflux anticipates range-bound trading to continue until Thursday’s data publications, with significant price movements more likely stemming from economic reports than from Federal Reserve communications.
Large Holder and Corporate Buying Activity
On the accumulation front, substantial wallet addresses are methodically increasing their positions. Addresses containing between 1,000 and 10,000 BTC have acquired roughly 240,000 BTC since December, elevating aggregate holdings to 3.09 million BTC — a concentration level not observed since November 2025.
Seasoned holders have maintained restrained distribution patterns. Just 42,100 BTC changed hands from long-term holders during the trailing 30-day period, representing one of the most modest distribution rates documented in 2026. Corporate and institutional allocators contributed approximately 92,900 BTC in fresh capital over the past month, per Bitwise’s Crypto Market Compass analysis.
Chart Formations and Price Zones
Examining the four-hour timeframe, Bitcoin has developed a potential double top configuration near $79,400 following two consecutive rejections during the previous week. Near-term price movement may gravitate toward liquidity concentrations at $74,700 and $73,700.
MN Capital’s founder Michaël van de Poppe maintains that upside objectives spanning $85,000–$88,000 remain achievable for May, contingent upon critical support zones holding firm.
Market analyst Ali Charts highlighted via social channels that Bitcoin is developing a Morning Star candlestick configuration on the monthly chart — a technical formation historically associated with significant trend reversals for BTC. He referenced over $1 billion in net taker volume registered on Binance as confirmation of buyer interest, identifying $73,000 as the critical support threshold.
Analyst Willy Woo assigned a 30% probability to BTC successfully penetrating the $79,000 cost basis representing recent investor positions during this current attempt, emphasizing that the subsequent three to six weeks will prove decisive in determining whether a structural price floor is materializing.
Current derivatives data reveals funding rates at -7% across a 30-day measurement period, representing one of the most negative readings historically documented — a condition that frequently precedes short squeeze dynamics should BTC advance beyond $80,000.
Get 3 Free Stock Ebooks
Discover top-performing stocks in AI, Crypto, and Technology with expert analysis.
- Top 10 AI Stocks - Leading AI companies
- Top 10 Crypto Stocks - Blockchain leaders
- Top 10 Tech Stocks - Tech giants

