
 Eyes Recovery After 68% Plunge: Institutional Interest Surges")
Key Takeaways
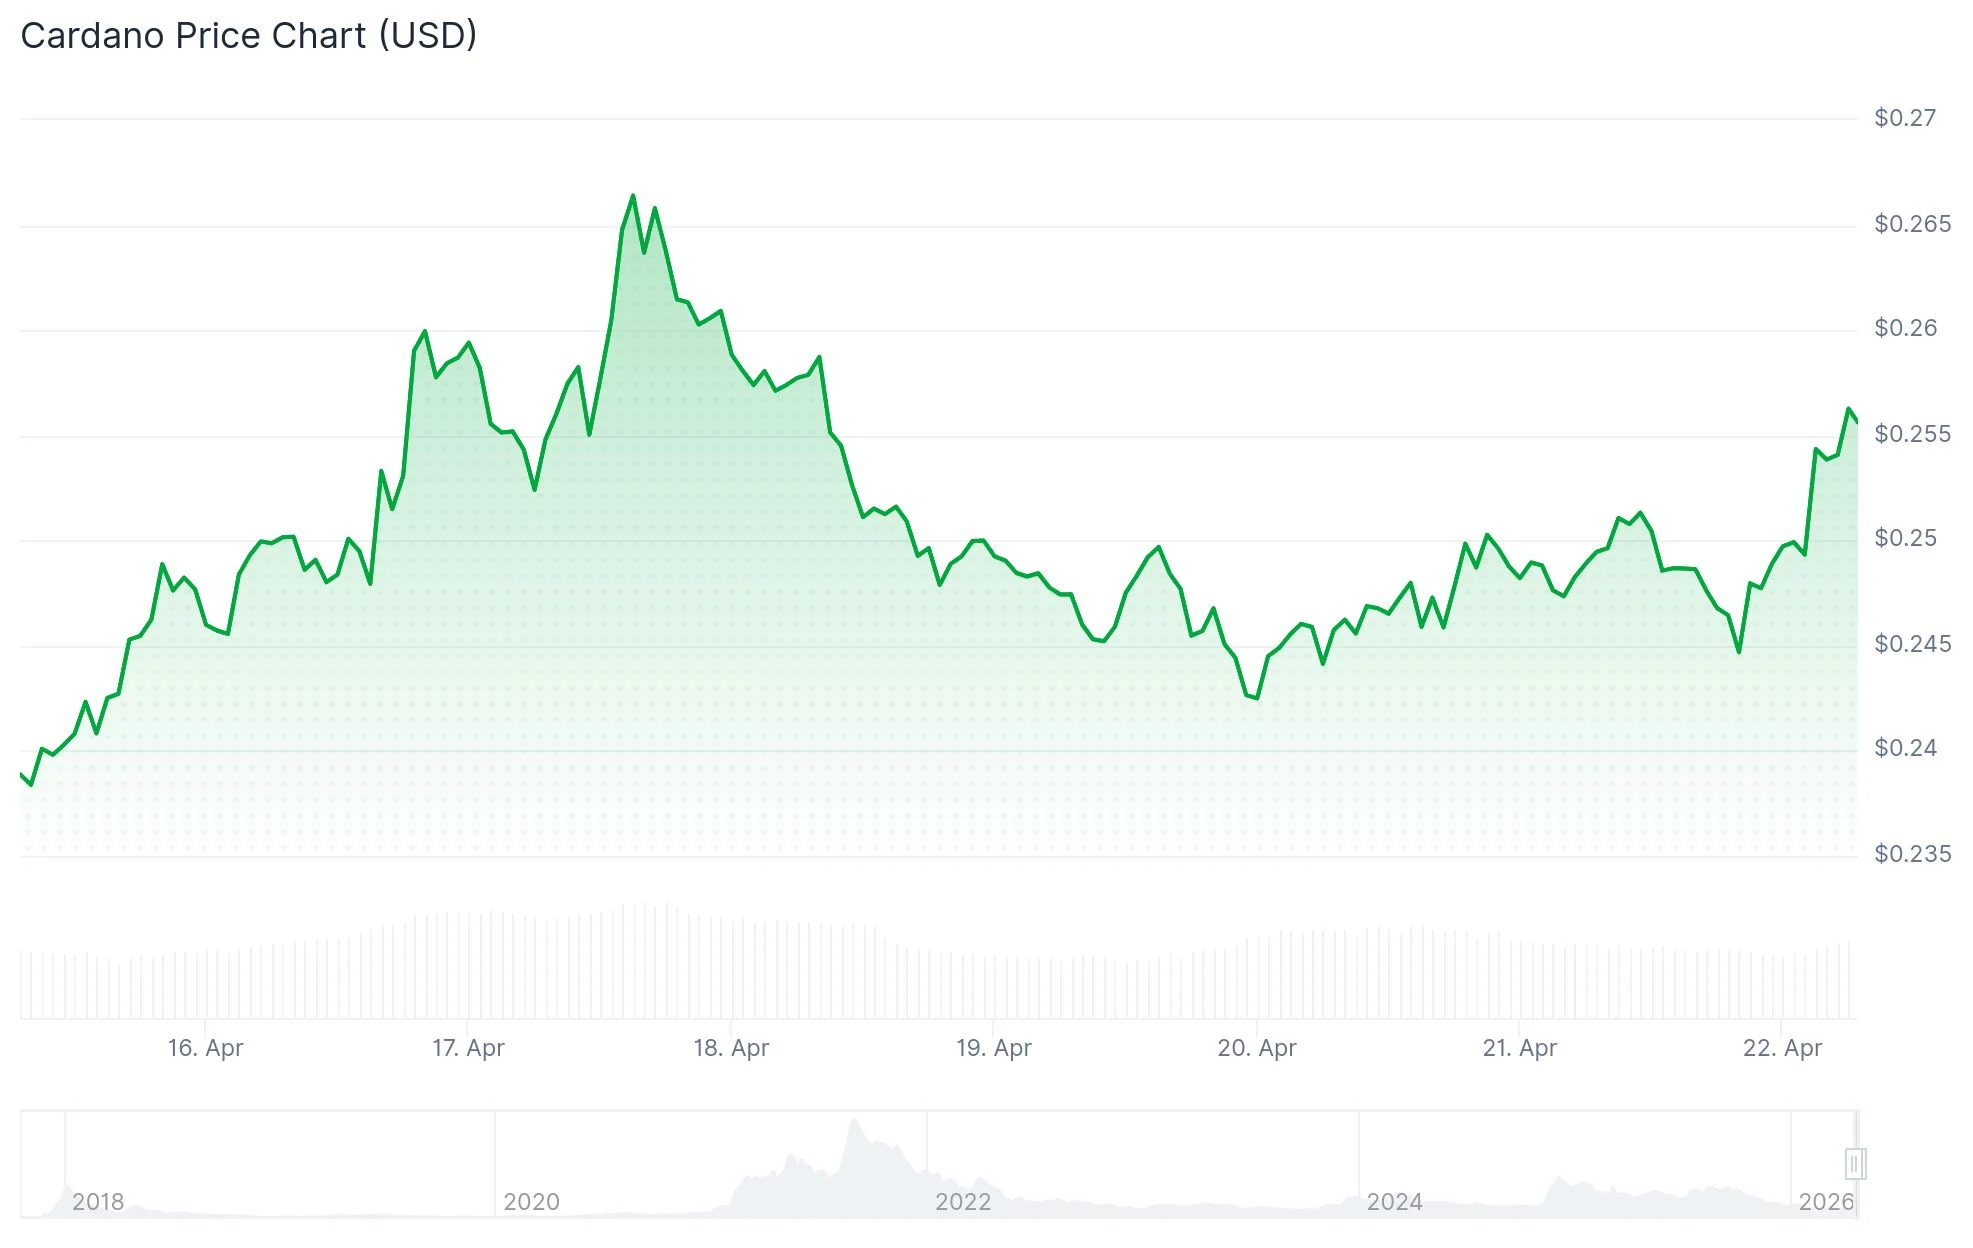
- ADA is currently trading near $0.25, posting modest gains on April 21
- CME futures contract volumes jumped 155% over two days, climbing from 27 to 69 contracts
- Open Interest in ADA futures increased by more than 5% within 24 hours, reaching $459.02 million
- Technical analysis reveals a falling wedge breakout with a projected target of $0.30
- The current long/short ratio stands at 0.73, creating conditions for a potential short squeeze
Cardano (ADA) has experienced a sustained decline since mid-January, plummeting 68% from its January 14 peak of $0.42 to approximately $0.25. However, emerging signals suggest the digital asset may be positioning for a potential rebound as market dynamics evolve.
The cryptocurrency market has witnessed the fear and greed index climb from 12 to 33 during the past week. Although the market remains within “fear” territory, this upward movement indicates diminishing selling pressure among investors.
Open Interest in ADA futures tracked by CoinGlass surged by over 5% in a 24-hour period, hitting $459.02 million. The positive funding rate of 0.0090% demonstrates that market participants are prepared to pay premiums to maintain long positions.

Data from CME Group reveals that ADA futures trading volumes soared from 27 contracts on April 15 to 69 contracts by April 17. This 155% increase over merely two trading sessions indicates rising institutional participation in the asset.
The prevailing long/short ratio registers at 0.73. Given that short sellers outnumber long position holders, an unexpected upward price movement could initiate forced liquidations, triggering cascading buy orders.

Funding rates have occasionally shifted into negative territory, indicating that traders are compensating to maintain bearish positions. This configuration creates the potential for a short squeeze if prices surge rapidly.
Technical Analysis Overview
From a charting perspective, ADA has emerged from a falling wedge formation. Confirmation of a complete bullish reversal requires multiple successive closes above the pattern’s upper boundary.
Measuring the wedge pattern’s height indicates that a rally from $0.25 to $0.30 would deliver a 23% return. Market analysts emphasize that breaking through $0.28 is essential before $0.30 becomes an achievable objective.
The 50-day exponential moving average (EMA) positioned at $0.26 currently represents the primary resistance barrier. The 100-day EMA resides at $0.3009 while the 200-day EMA stands at $0.3953, both serving as significant overhead obstacles.
The Relative Strength Index (RSI) oscillates around 51, indicating that momentum is consolidating but lacks decisive strength. Market participants appear cautious at present resistance zones.
The MACD histogram maintains a marginal position above its signal line, producing a slightly positive reading. This configuration suggests the trend may pivot bullish, though definitive confirmation remains absent.
Critical Support Zones
Regarding downside protection, ADA maintains crucial support at $0.2328, established as the March 29 low. Beneath that threshold, $0.2205 represents the February 6 low and would serve as the subsequent defensive level.
As of April 21, ADA was exchanging hands at roughly $0.2554, sustaining positions above the $0.25 threshold for three straight days. The 50-day EMA at $0.26 continues to represent the immediate obstacle for any sustained upward movement.
Get 3 Free Stock Ebooks
Discover top-performing stocks in AI, Crypto, and Technology with expert analysis.
- Top 10 AI Stocks - Leading AI companies
- Top 10 Crypto Stocks - Blockchain leaders
- Top 10 Tech Stocks - Tech giants

