
 Navigates Critical Support Zone as May Volatility Looms")
Key Takeaways
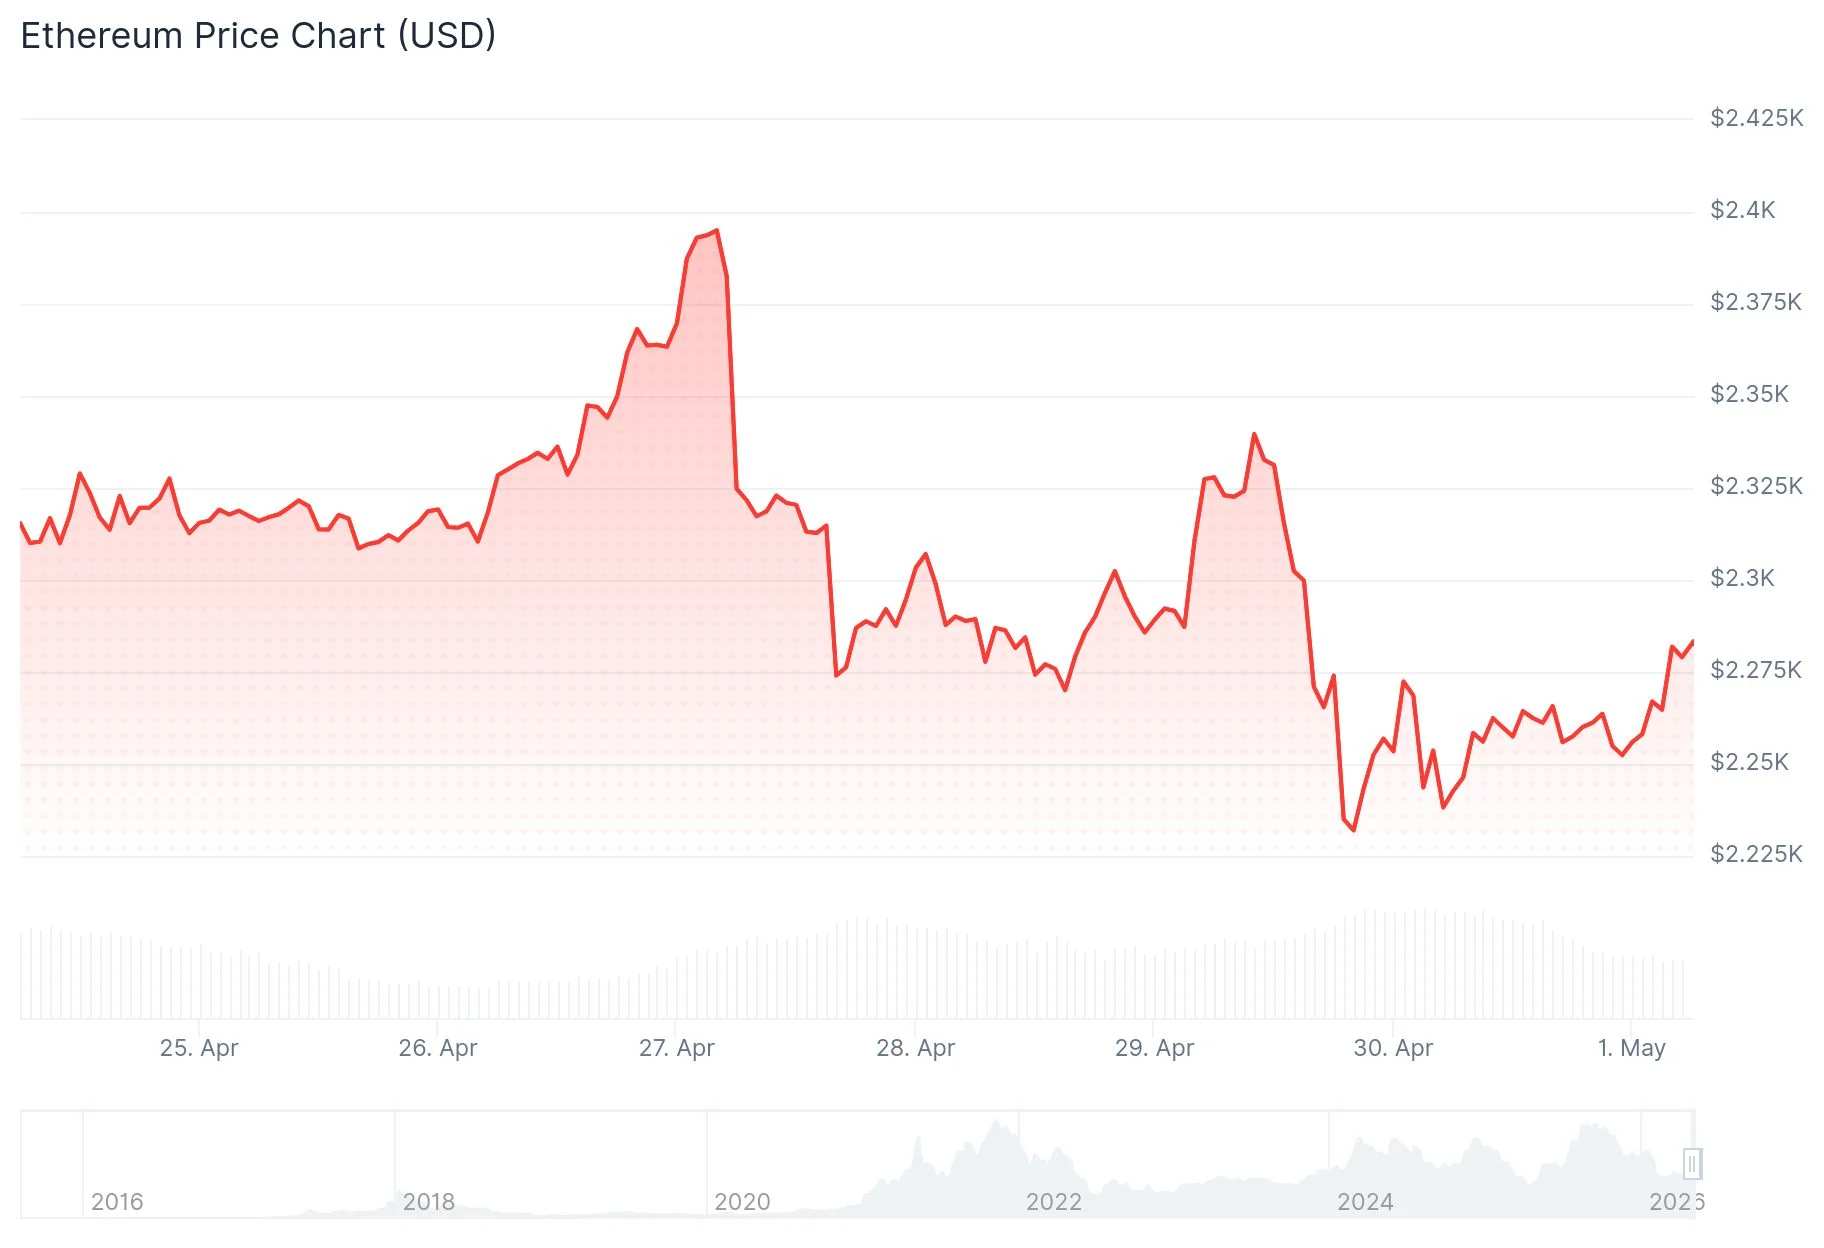
- Ethereum currently sits around $2,260, pressured by elevated US inflation figures and broader macroeconomic uncertainty.
- Derivatives markets reveal negative taker buy-sell ratios and funding rates, indicating bearish short-term trader sentiment.
- Crypto analyst Ted Pillows highlights the $2,150–$2,200 range as crucial, warning that breaking below could accelerate downside momentum.
- Binance-specific data contradicts broader trends, showing taker buy-sell ratios above 1, suggesting more aggressive buying activity.
- Historical patterns indicate May typically brings extreme volatility for Ethereum, with potential for significant swings in either direction.
Ethereum is currently hovering near $2,260 as a combination of macroeconomic pressures and conflicting derivatives signals set the tone for the beginning of May.
March’s US Personal Consumption Expenditures (PCE) Price Index showed a 3.5% year-over-year increase, a notable jump from February’s 2.8%. More concerning for markets, the core PCE—the Federal Reserve’s preferred inflation gauge—rose to 3.2%, marking its highest reading since November 2023. Persistent inflation dims expectations for near-term rate cuts, generally dampening appetite for risk assets including cryptocurrencies.
Adding to market caution, ongoing geopolitical tensions in the Middle East continue to weigh on broader financial sentiment.
Looking at Ethereum futures, the taker buy-sell ratio has shifted into negative territory. This indicator measures the balance between aggressive buyers and sellers executing market orders on perpetual contracts. The 14-day moving average has been trending downward since mid-April.

Further reinforcing bearish sentiment, ETH funding rates have remained negative throughout this timeframe. When funding rates turn negative, short sellers are compensating long holders, reflecting pessimistic positioning among derivatives traders.

Meanwhile, open interest has declined to approximately 13.5 million ETH from 14.4 million ETH recorded on April 18. This contraction indicates traders are closing positions rather than establishing new ones.
Critical Price Zones Under the Microscope
From a technical perspective, ETH is currently trading beneath both its 20-day exponential moving average at $2,287 and its 100-day EMA positioned near $2,365. The Relative Strength Index (RSI) remains close to the neutral 50 level, while the Stochastic Oscillator has entered oversold territory.
Ethereum’s realized price—representing the average cost basis across all on-chain holdings—currently stands at $2,308. This level has proven to be resistance, with price rejections occurring as holders appear to be selling near their break-even points.
Immediate support is located at $2,211, with additional backing from the 50-day EMA around $2,244. Should these levels fail to hold, subsequent support zones emerge at $2,108, $1,909, and $1,741.
Market analyst Ted Pillows has identified the $2,150–$2,200 range as particularly critical, warning that a breakdown below this zone could lead to “accelerated” selling pressure. He views this area as a potential foundation for a recovery bounce.
Over the past 24 hours, Ethereum experienced $38.2 million in total liquidations, with short positions accounting for $19.5 million of that figure.
Binance Metrics Show Contrasting Picture
Interestingly, Binance-specific data tells a different story. The exchange’s taker buy-sell ratio currently exceeds 1, according to CryptoQuant information analyzed by Rei Researcher. This diverges from the broader market trend and indicates that buyers on Binance are exhibiting more aggressive behavior than sellers.
Open interest on the platform has shown modest increases from recent lows, suggesting gradual accumulation of long positions. That said, overall leverage expansion remains constrained, which diminishes the risk of cascading liquidation events.
May’s Historical Volatility Pattern
Historical performance data compiled by CoinGlass reveals that May ranks among Ethereum’s most volatile months. Both average and median returns for May occupy the extreme ends of the spectrum—characterized by pronounced gains and significant losses compared to other calendar months.
Daan Crypto Trades emphasized this seasonal pattern, observing that May frequently delivers outsized price movements rather than gradual, steady trends.
Ethereum began May 2026 trading in the vicinity of $2,261.
Get 3 Free Stock Ebooks
Discover top-performing stocks in AI, Crypto, and Technology with expert analysis.
- Top 10 AI Stocks - Leading AI companies
- Top 10 Crypto Stocks - Blockchain leaders
- Top 10 Tech Stocks - Tech giants

