
 Price Breaks Above Realized Price as $3,000 Target Emerges")
Key Highlights
- Ethereum reached $2,390, breaking above its $2,320 realized price level, returning the average holder to profitability
- Technical analysis reveals a bull flag formation on the daily timeframe projecting a move to $3,018
- Crypto analyst Dami-Defi anticipates a decisive move beyond $2,400 could spark a rapid advance toward the $2,800–$3,000 zone
- Approximately 7.1 million ETH positioned between $2,750–$2,850 represents significant overhead resistance
- The Relative Strength Index has rebounded to 56 after touching near-oversold territory at 36 in March
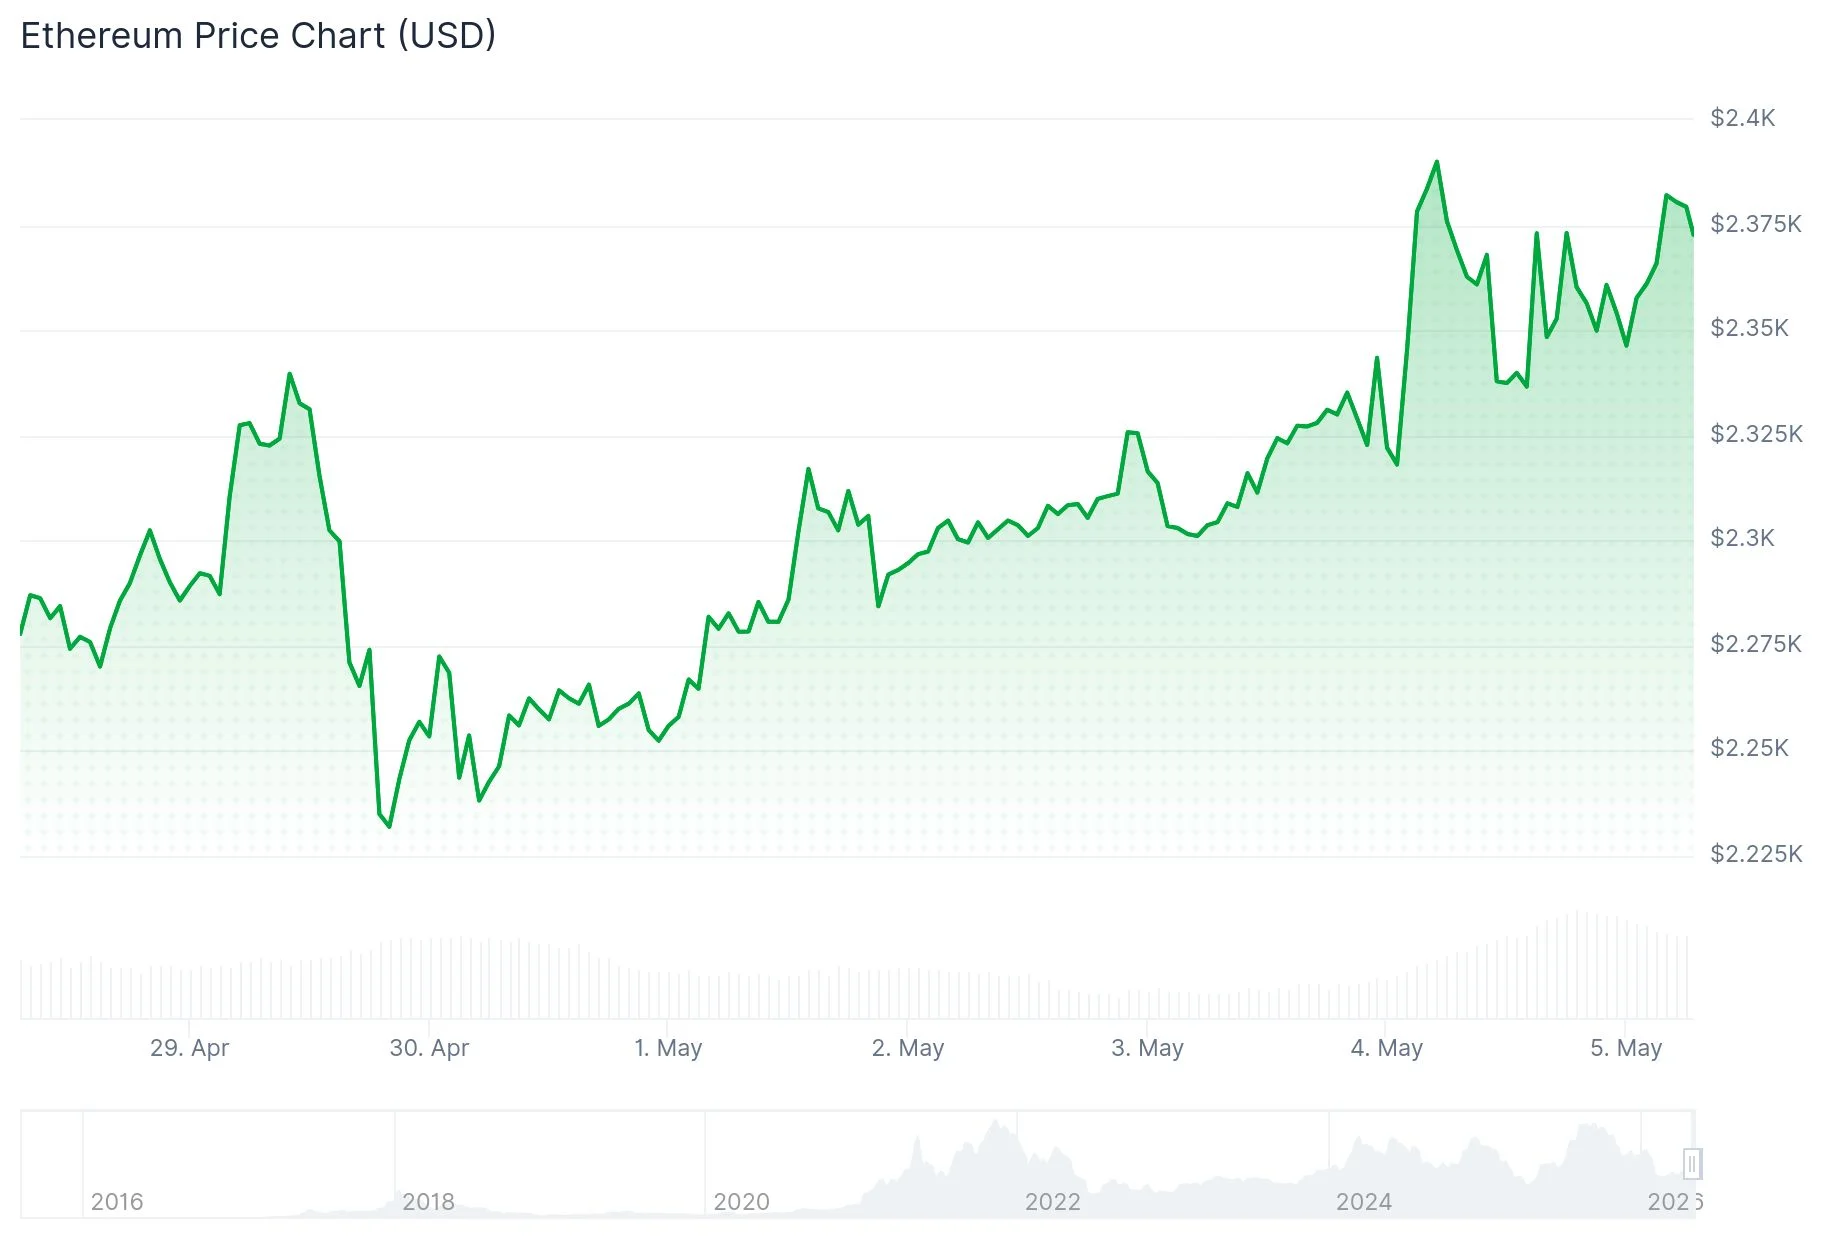
Ethereum has successfully reclaimed its realized price threshold of $2,320, marking a significant shift that puts the average ETH investor back into positive territory. The cryptocurrency peaked at $2,398 during recent trading before settling near $2,376, reflecting a 2.2% gain over the last day alongside $24.23 billion in trading volume.
The realized price represents the aggregate cost basis for all ETH tokens that have transferred on the blockchain. Historically, when price action moves above this metric, market psychology tends to shift from bearish caution to bullish optimism.
When Ethereum successfully broke above this threshold in May 2025, the asset subsequently surged 173% to reach its record peak of $4,950. Similarly, when this level was recaptured in early 2023, ETH posted a 58% appreciation.
Market analyst Dami-Defi shared insights on X suggesting that penetration beyond the $2,400–$2,600 corridor would initiate the “most violent move of the year” targeting $3,000, declaring: “Once we break $2,400 we will catapult violently to $2,800–$3,000.” The commentary referenced accumulating momentum visible on the weekly timeframe.
Technical Pattern Suggests $3,018 Upside Objective
Examining the daily chart, Ethereum has developed a textbook bull flag configuration. Price action is currently testing the $2,350 resistance zone, where the pattern’s upper trendline intersects with the 100-day exponential moving average.
A confirmed daily candle close above this critical juncture would activate a measured move projection to $3,018. Technical analyst Cohelson David separately noted a broadening wedge structure on the 12-hour chart also indicating potential toward the $3,000 level.

The RSI indicator has climbed back to 56 after dipping to near-oversold readings of 36 during late March, signaling renewed accumulation and buying pressure.
Significant Resistance Zone at $2,800
While the technical picture appears constructive, a substantial barrier exists in the $2,750 to $2,850 range. Approximately 7.1 million ETH tokens were purchased at average prices within this corridor, establishing a concentration zone where numerous holders may attempt to exit at breakeven.
Cryptocurrency analyst Crypto Patel identified $2,400, $2,700, and $3,000 as critical resistance thresholds worth monitoring. He cautioned that inability to clear $2,400 decisively might trigger a retracement toward $2,000 support.
The MACD indicator shows the MACD line at 25.03 positioned beneath the signal line at 32.00, producing a histogram value of -6.97, indicating some near-term momentum deterioration.
Immediate support is established at $2,323, with additional downside cushions located at $2,219 and $2,179. Ethereum maintains a market capitalization of $282.39 billion.
ETH continues trading above both $2,360 and its 100-hour simple moving average, while a bullish trendline provides support at $2,350 on the hourly chart structure.
Get 3 Free Stock Ebooks
Discover top-performing stocks in AI, Crypto, and Technology with expert analysis.
- Top 10 AI Stocks - Leading AI companies
- Top 10 Crypto Stocks - Blockchain leaders
- Top 10 Tech Stocks - Tech giants

