
 Price Faces Critical Test After Rejecting $2,400 Four Times")
Key Takeaways
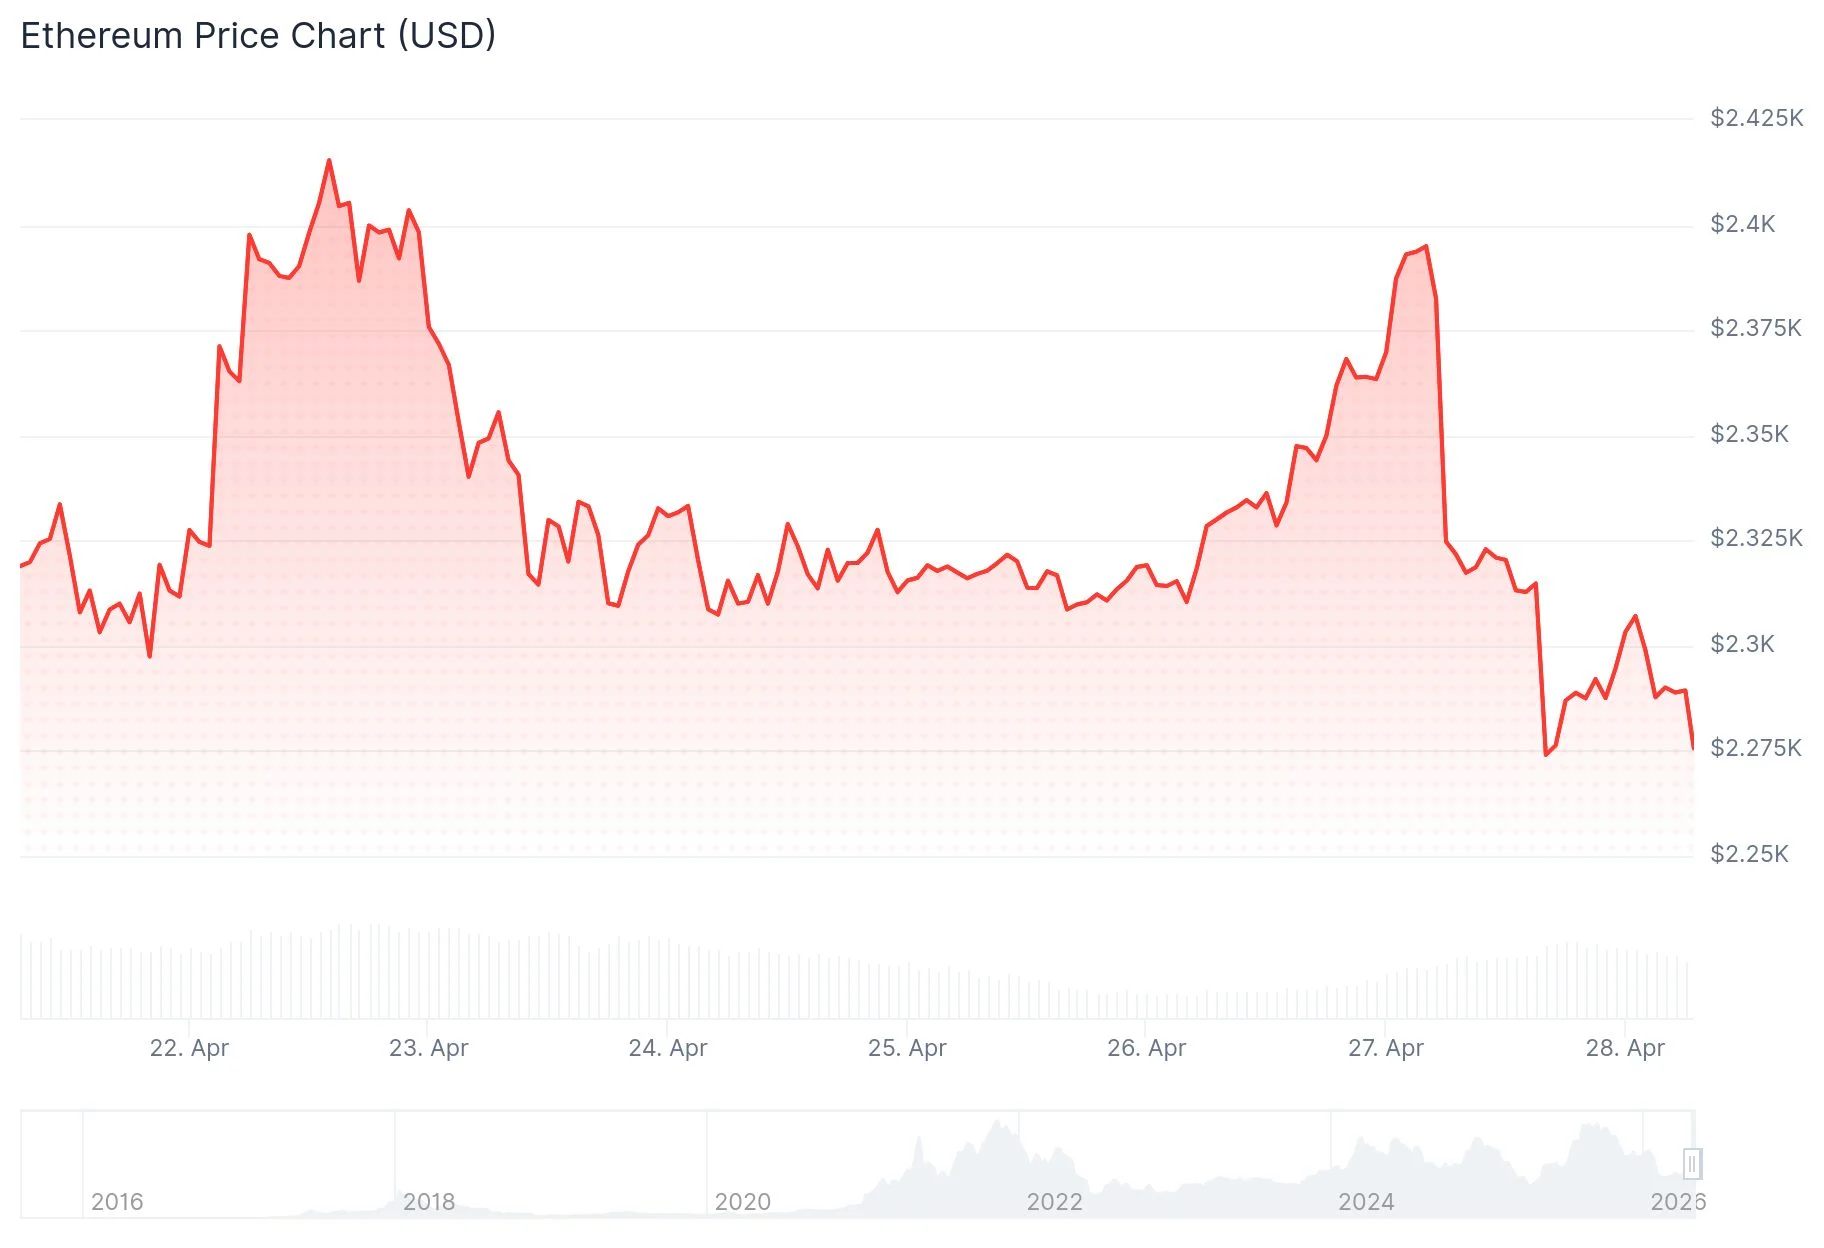
- Ethereum declined 3.4% to $2,287 following its fourth consecutive rejection at the $2,400 resistance barrier
- Daily chart analysis reveals a triple top formation, with critical support established at $2,150
- More than $2.5 billion in leveraged long positions face liquidation risk beneath the $2,150 level
- ETH/BTC pair weakness emerged as the ratio fell under 0.032, indicating underperformance versus Bitcoin
- Higher timeframe analysis suggests accumulation phase continues, though definitive breakout remains elusive
Ethereum’s price action has encountered repeated resistance at $2,400 since mid-April, with four distinct rejections establishing a triple top formation on daily timeframes. Monday’s session saw ETH retreat 3.4% to reach $2,287, extending a pattern of unsuccessful breakout attempts.
The 100-day exponential moving average positioned around $2,350 continues serving as dynamic resistance. Daily closes above this technical barrier remain absent, constraining upward momentum and limiting rally duration.
Michaël van de Poppe, analyst at MN Capital, highlighted deteriorating conditions in the ETH/BTC trading pair. The ratio breached the 0.032 BTC threshold, violating a support zone that had previously sustained bullish attempts. Additionally, the ratio crossed beneath its 21-period moving average, reinforcing evidence of diminishing strength relative to Bitcoin.
For the ETH/BTC pair, the subsequent higher timeframe support zone appears near 0.026 BTC, a region where demand has historically emerged.
Critical $2,150 Support Under Scrutiny
Market participants are now concentrating attention on the $2,150 price zone. This level previously functioned as resistance before transitioning into support. Should this threshold fail, ETH would likely test the $2,050 to $1,900 territory.

CoinGlass liquidation analytics indicate more than $2.5 billion in leveraged long contracts positioned immediately beneath $2,150. A decisive move through this support could catalyze cascading liquidations.
Binance data shows Ether open interest has contracted to $2.58 billion, matching levels observed during earlier April trading around $2,200. The funding rate currently hovers near -0.013%, representing its weakest reading since February, with short-side positioning now prevalent in fresh market activity.
Analyst Amr Taha observed this configuration—reduced leverage combined with short-dominant positioning—may create conditions for an upward price squeeze should ETH maintain stability around present levels.
Higher Timeframe Analysis Points to Accumulation
Crypto Patel published a two-week timeframe chart on X illustrating Ethereum positioned near the bottom boundary of an extended rising channel pattern. The $1,700 to $2,250 zone is characterized as a liquidity capture and accumulation area, functioning as substantial support since 2022.
Immediate overhead resistance emerges near $2,480, with secondary resistance spanning $3,500 to $4,900, encompassing the vicinity of the prior all-time high around $4,876.
James Easton’s three-day chart shared on X demonstrates a recurring pattern where significant rallies materialized following substantial retracements. A white marker indicates the present 2026 low, implying ETH may be constructing another foundational base.
Neither chart provides confirmation of an imminent rally. Ethereum must successfully defend the accumulation zone and recapture the $2,480 level before any constructive scenario gains credibility.
The decisive level remains $2,150, where technical support structure intersects with substantial liquidation vulnerability on daily charts.
Get 3 Free Stock Ebooks
Discover top-performing stocks in AI, Crypto, and Technology with expert analysis.
- Top 10 AI Stocks - Leading AI companies
- Top 10 Crypto Stocks - Blockchain leaders
- Top 10 Tech Stocks - Tech giants

