
 Teeters Above $2,100 as Analyst Flags Major Breakdown Risk")
Key Takeaways
- ETH currently trades around $2,130, representing a ~12% decline from its recent peak of $2,420
- Potential US-Iran ceasefire could provide relief through lower oil prices
- Ethereum ETFs witnessed $33M in net redemptions on May 21
- Approximately $1.7B in long positions at risk of liquidation below $2,044
- Critical support zone at $2,080 — failure could accelerate selling toward $1,800
Ethereum continues clinging to support just above the $2,100 threshold while traders monitor several converging threats that could drive prices substantially lower.
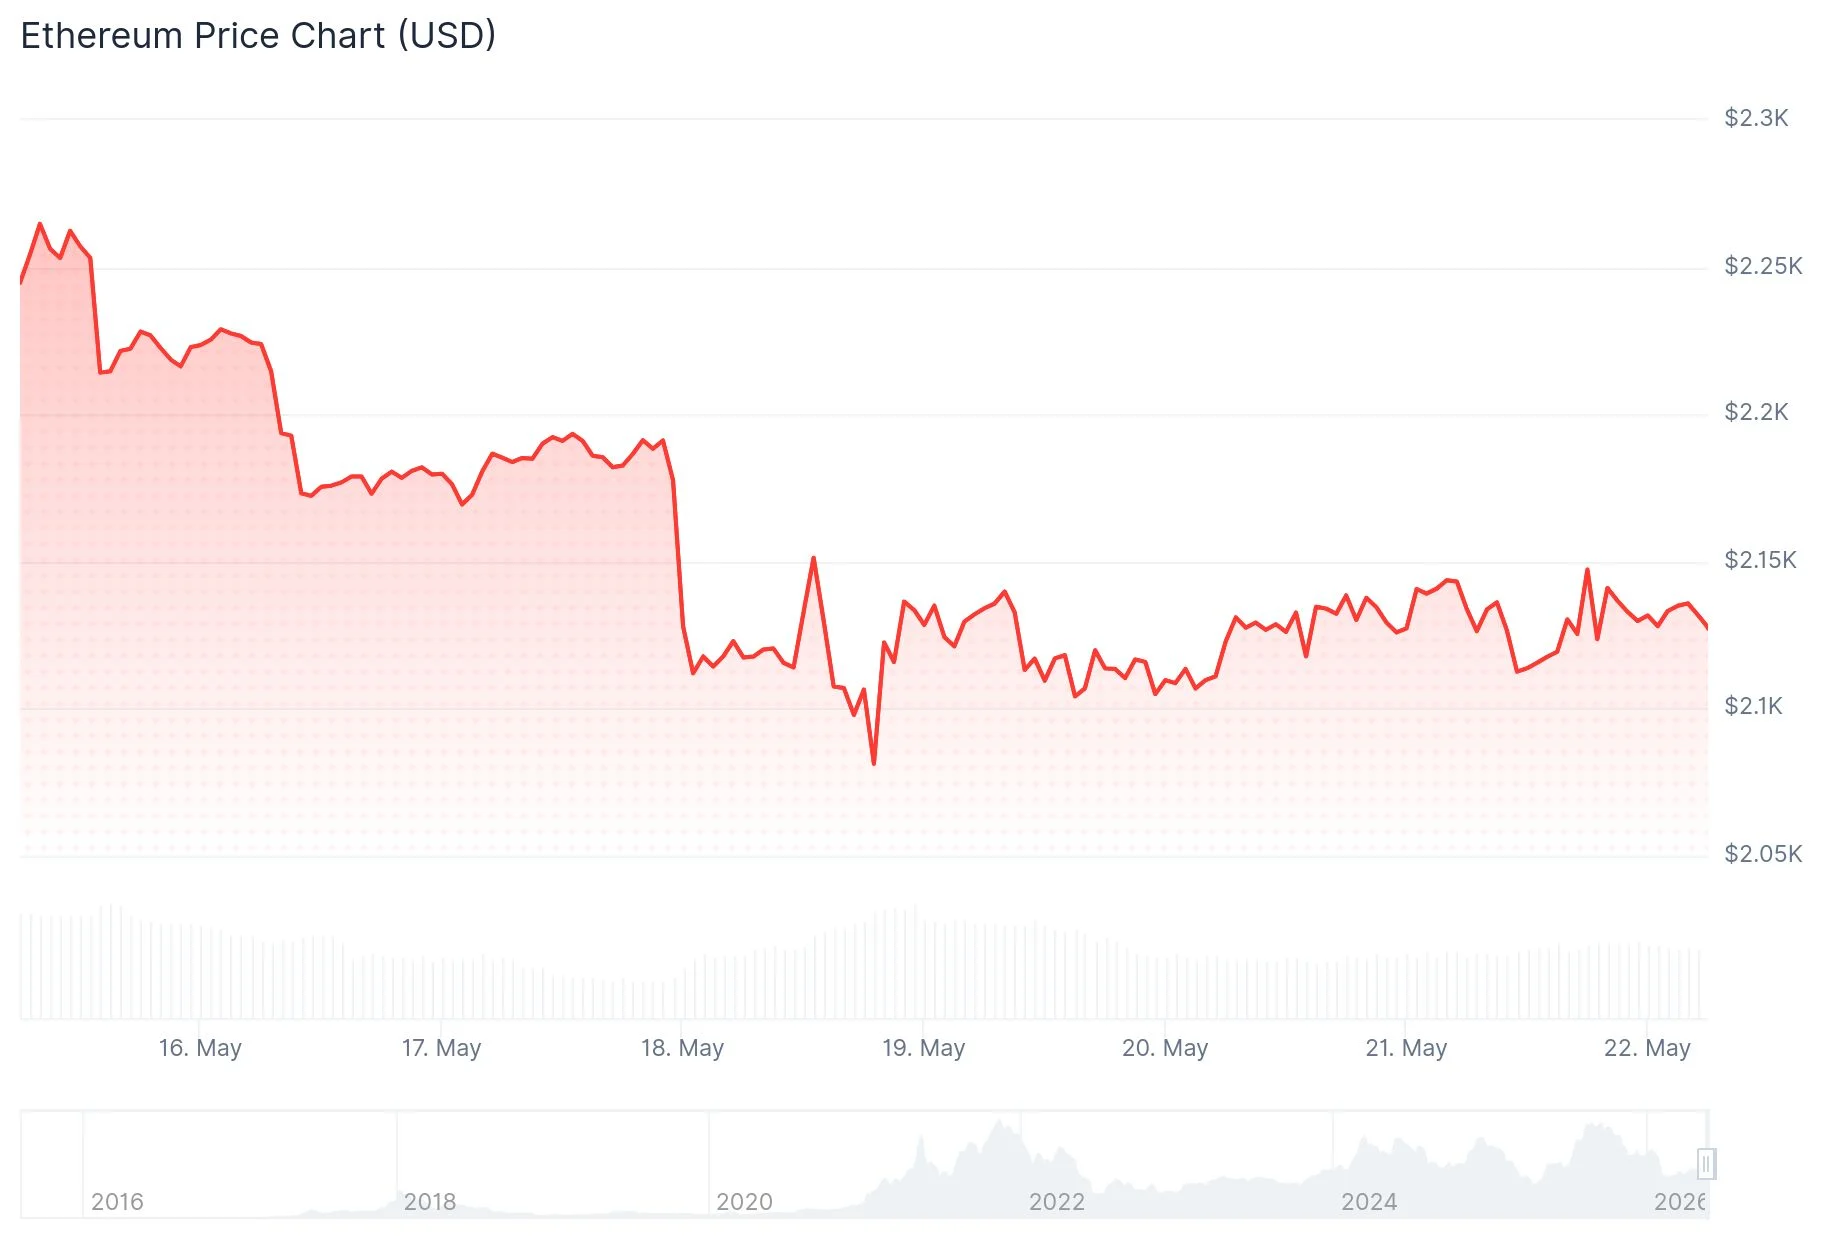
On Wednesday, ETH exchanged hands near $2,129, marking approximately a 12% retreat from its recent peak around $2,420. The pullback coincided with US Treasury yields surging to 4.58%, representing the highest reading in months after inflation data exceeded forecasts. Elevated yields typically steer capital toward traditional safe havens and away from cryptocurrency markets.
Spot Ethereum ETF activity intensified the downward momentum. May 21 data revealed $33M in net redemptions from ETH ETFs, extending a pattern of consecutive withdrawal days. Bitcoin ETFs similarly experienced $101M in outflows during the same period, while Solana ETFs stood as the sole exception with $4M in fresh capital.
[[EMBED_0]]BitMEX co-founder Arthur Hayes highlighted a fundamental challenge. “Ethereum ETFs still lack the structural yield advantage many institutions expected,” Hayes noted. “Until staking is integrated into these products, capital allocation will remain skewed toward Bitcoin.”
Geopolitical Developments and Energy Market Impact
Thursday brought reports that the United States and Iran are approaching a ceasefire agreement, with Pakistan serving as mediator. The proposed deal allegedly incorporates a joint monitoring framework for the Strait of Hormuz. In response, US crude oil prices retreated from above $100 to approximately $96.

BitMine Immersion Chairman Thomas Lee commented on X that resolving the conflict could “decisively” influence oil valuations — and consequently, Ethereum. “Higher oil equals higher probability of Fed hikes,” Lee stated. “And ETH and crypto prices are linked to monetary liquidity. Thus, crypto will be inversely correlated to oil.”
Lee’s company, BitMine, maintains the largest corporate Ethereum holdings, with approximately 5.278 million ETH in treasury.
[[EMBED_1]]Analyst Ted Pillows expressed a more cautious outlook, writing on X: “This doesn’t look good for $ETH. Ethereum needs to hold above the $2,100 level, or things could get ugly.” His assessment echoes widespread trader anxiety that the $2,100 area represents a decisive battleground.
Chart Patterns Signal Growing Weakness
Daily timeframe analysis shows Ethereum violated a rising channel formation and now trades beneath its 20-, 50-, and 100-day exponential moving averages, which converge between $2,225 and $2,326. The MACD indicator has crossed into negative territory, validating bearish momentum.
Blockchain metrics compound the concern. Addresses controlling more than 10,000 ETH have declined to their lowest count in nearly 10 months. Meanwhile, net ETH deposits to centralized exchanges have reached their highest level since early 2025 — suggesting increased selling pressure from holders.
CoinGlass analytics reveal over $1.7B in leveraged long positions clustered between $2,044 and $2,000. A breakdown through this range could spark a liquidation cascade. The past 24 hours alone witnessed $47.9M in total ETH position liquidations.
Immediate support levels to monitor include $2,080, with subsequent floors at $1,909 and $1,800.
Get 3 Free Stock Ebooks
Discover top-performing stocks in AI, Crypto, and Technology with expert analysis.
- Top 10 AI Stocks - Leading AI companies
- Top 10 Crypto Stocks - Blockchain leaders
- Top 10 Tech Stocks - Tech giants

