
 Token Explodes 6,000%: Analyzing the On-Chain Dynamics Behind the Rally")
Key Takeaways
- RAVE experienced a staggering 6,000% price increase within one week, catapulting its market capitalization to $4.1B and securing the 22nd position globally, surpassing both Avalanche and Sui.
- Blockchain analytics reveal approximately 90% of RAVE tokens are concentrated in three wallets associated with the project, with 18.58M tokens transferred to Bitget just before the price explosion.
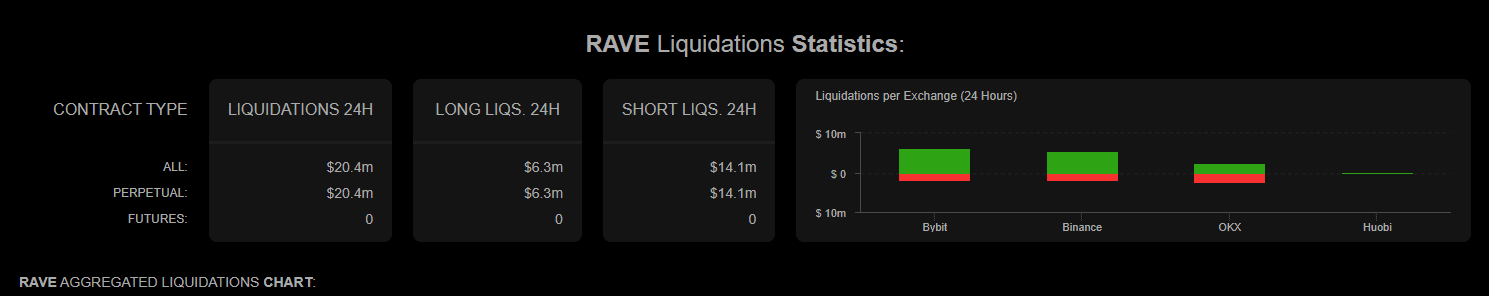
- This strategic token movement was followed by between $17M and $21.72M in forced short liquidations over a 24-hour period, while long position liquidations totaled only $7.12M.
- Technical indicators showed extreme overbought conditions with RSI reaching 99.59 and price action extending $4 beyond the upper Bollinger Band, even as derivatives trading volume contracted by 25% and open interest declined from its $494M apex.
- KuCoin integrated RAVE for spot trading on April 17, 2026, expanding the token’s exchange accessibility.
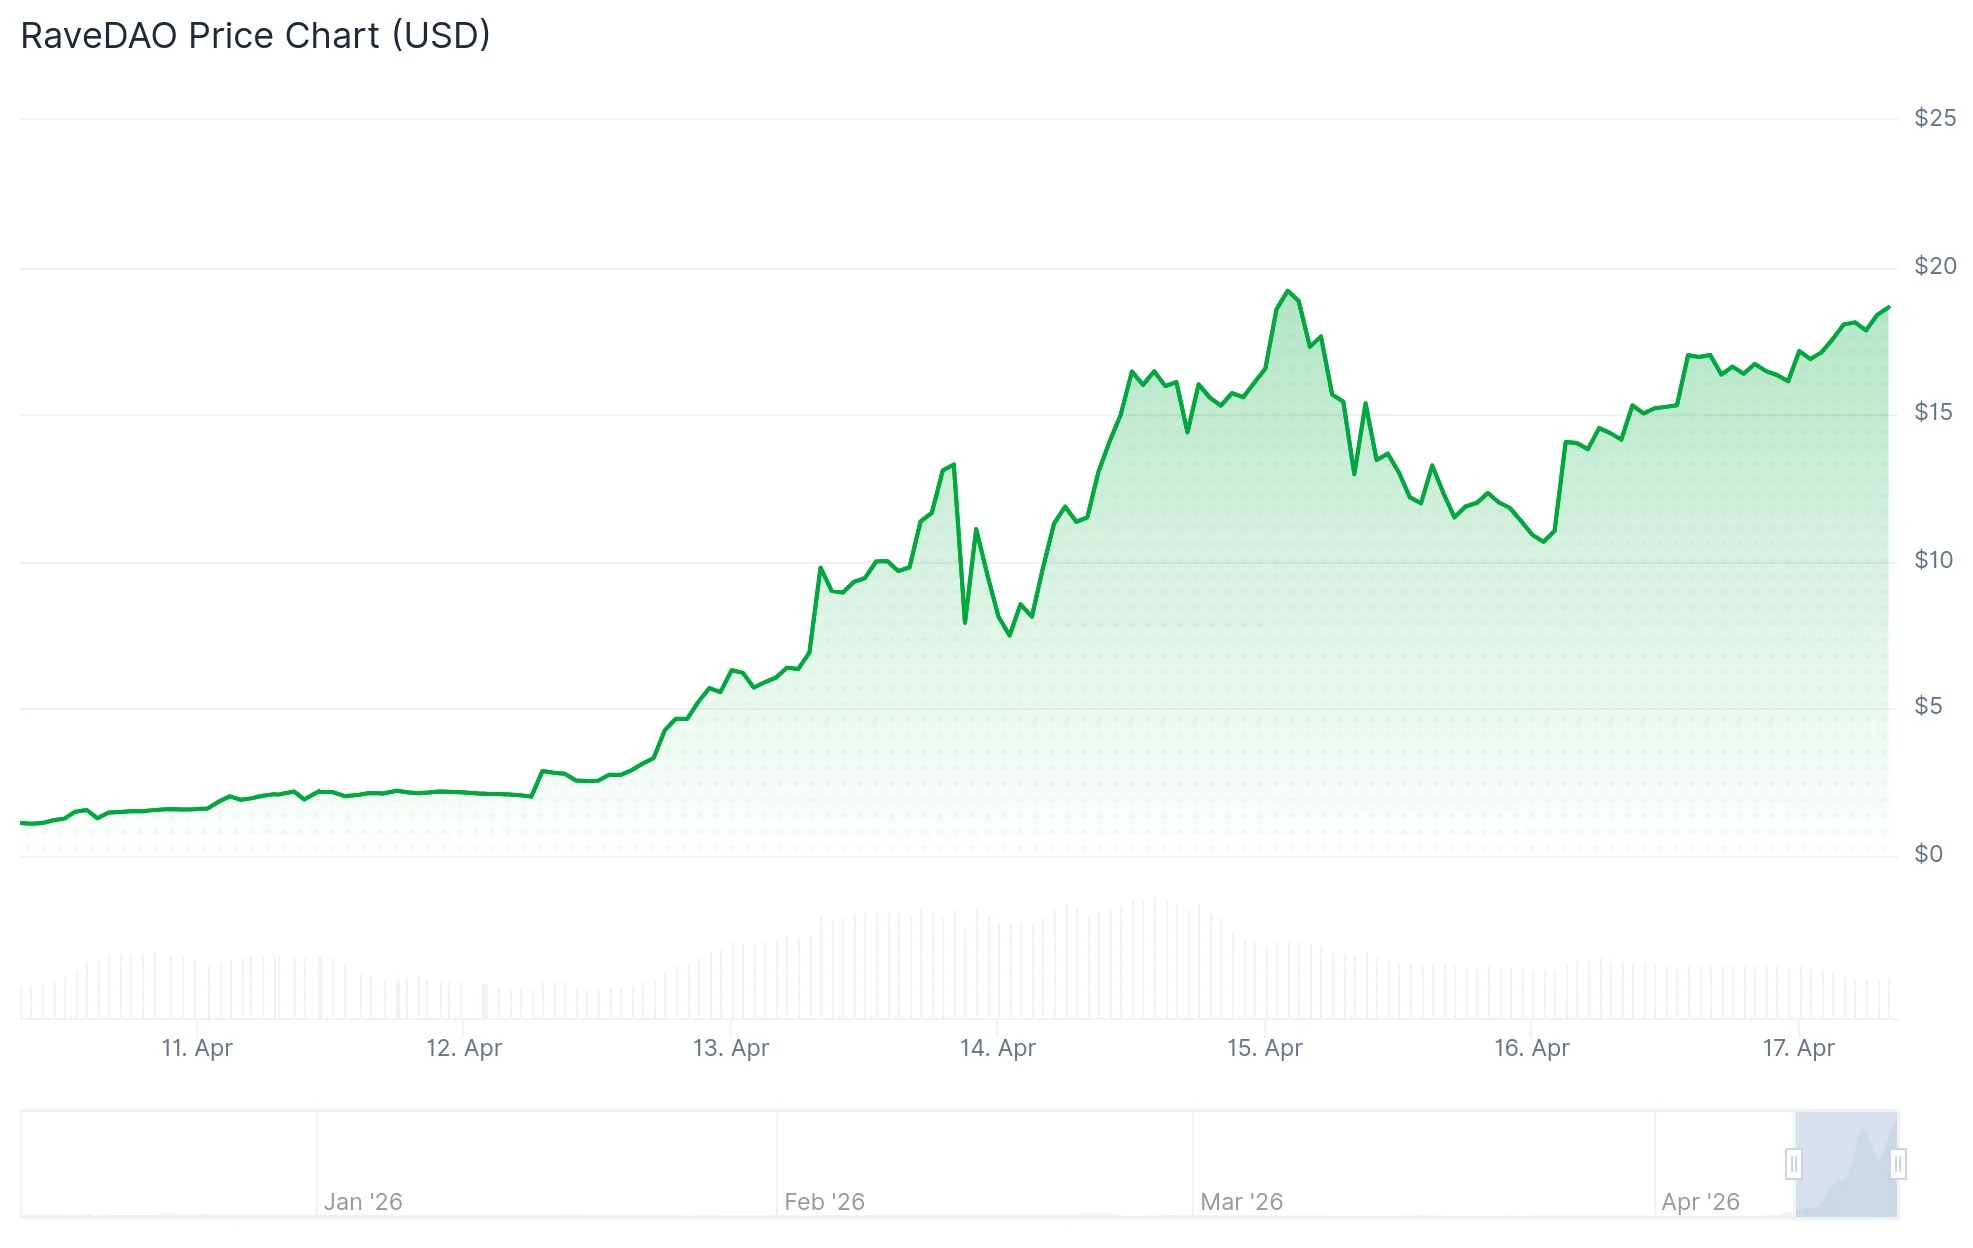
From January through early April 2026, RAVE maintained a relatively stable trading range around $0.20. The token then experienced an explosive vertical move, climbing more than 6,000% within a single week to reach an intraday peak of $19.771 before closing at $16.74, representing a 1.09% daily increase at the time of analysis. This remarkable ascent elevated the project’s market capitalization to $4.1B, positioning it at rank 22 among all cryptocurrencies — notably outranking established layer-1 protocols such as Avalanche and Sui.
The rally occurred without conventional catalysts like product releases, strategic partnerships, or financial disclosures.
Blockchain forensics highlight significant supply centralization. Approximately 90% of RAVE’s circulating supply remains locked within three Gnosis Safe multisignature wallets connected to the project infrastructure. In the hours immediately preceding the price surge, a substantial transfer of 18.58M tokens was executed to the Bitget exchange platform. This movement preceded a cascading liquidation event that eliminated between $17M and $21.72M in short positions over a 24-hour window, while long position liquidations represented merely $7.12M in comparison.
Technical Indicators Signal Extreme Overbought Territory
From a technical analysis perspective, RAVE’s price chart exhibited some of the most extended readings observable in cryptocurrency markets. The Relative Strength Index (RSI) registered 99.59, approaching the theoretical maximum on the indicator’s scale. Price discovery occurred nearly $4 above the upper Bollinger Band boundary, which was positioned at $12.946. The median Bollinger Band registered at $2.805, while the pre-breakout consolidation zone ranged between $0.20 and $0.25. A previous RSI spike during March similarly reached overbought thresholds before experiencing a sharp price retracement.
Derivatives market data provided additional context. Open interest reached a zenith near $494M before contracting to a range between $448.91M and $458.52M. Trading volume experienced a 25.04% decline, settling at $10.29B. Platform-specific positioning data revealed Binance traders favoring short positions with a 0.6656 ratio, while OKX participants demonstrated a long bias at 1.1.

Price Correction Phase and Exchange Expansion
By April 15, RAVE transitioned into what market observers characterized as a managed retracement period. The Stochastic RSI indicator migrated toward oversold readings, while short liquidations accumulated to $14M across a 24-hour timeframe, indicating continued pressure on bearish positions. Open interest expanded to $141M during this consolidation phase despite price depreciation, which some technical analysts interpreted as strategic repositioning rather than mass capitulation.
On April 17, 2026, KuCoin formally integrated RAVE for spot market trading paired with USDT, with deposit functionality immediately available and withdrawal services commencing April 18.
Get 3 Free Stock Ebooks
Discover top-performing stocks in AI, Crypto, and Technology with expert analysis.
- Top 10 AI Stocks - Leading AI companies
- Top 10 Crypto Stocks - Blockchain leaders
- Top 10 Tech Stocks - Tech giants

