
 Price Analysis: Can SOL Break Through $100 Resistance?")
Key Highlights
- SOL maintains position around $87–$88, holding firmly above its 50-day EMA with critical resistance between $90–$94
- Technical expert Ali Martinez identified a compressed Bollinger Band formation spanning $77 to $94 on the 3-day timeframe
- Solana ETFs attracted $9.44 million in net weekly capital, extending a five-day positive streak that accumulated approximately $1.45 billion
- Goldman Sachs revealed holdings valued at roughly $108 million in Solana
- Breaking decisively above $94 could trigger a rally toward the $100 milestone; falling beneath $77 may trigger downside continuation
Solana (SOL) maintains its position near the $87–$88 range on Monday, sustaining levels above its 50-day Exponential Moving Average (EMA) positioned at $87.04. Following a bounce from recent lows around $84.55, the cryptocurrency is now challenging a significant resistance area.
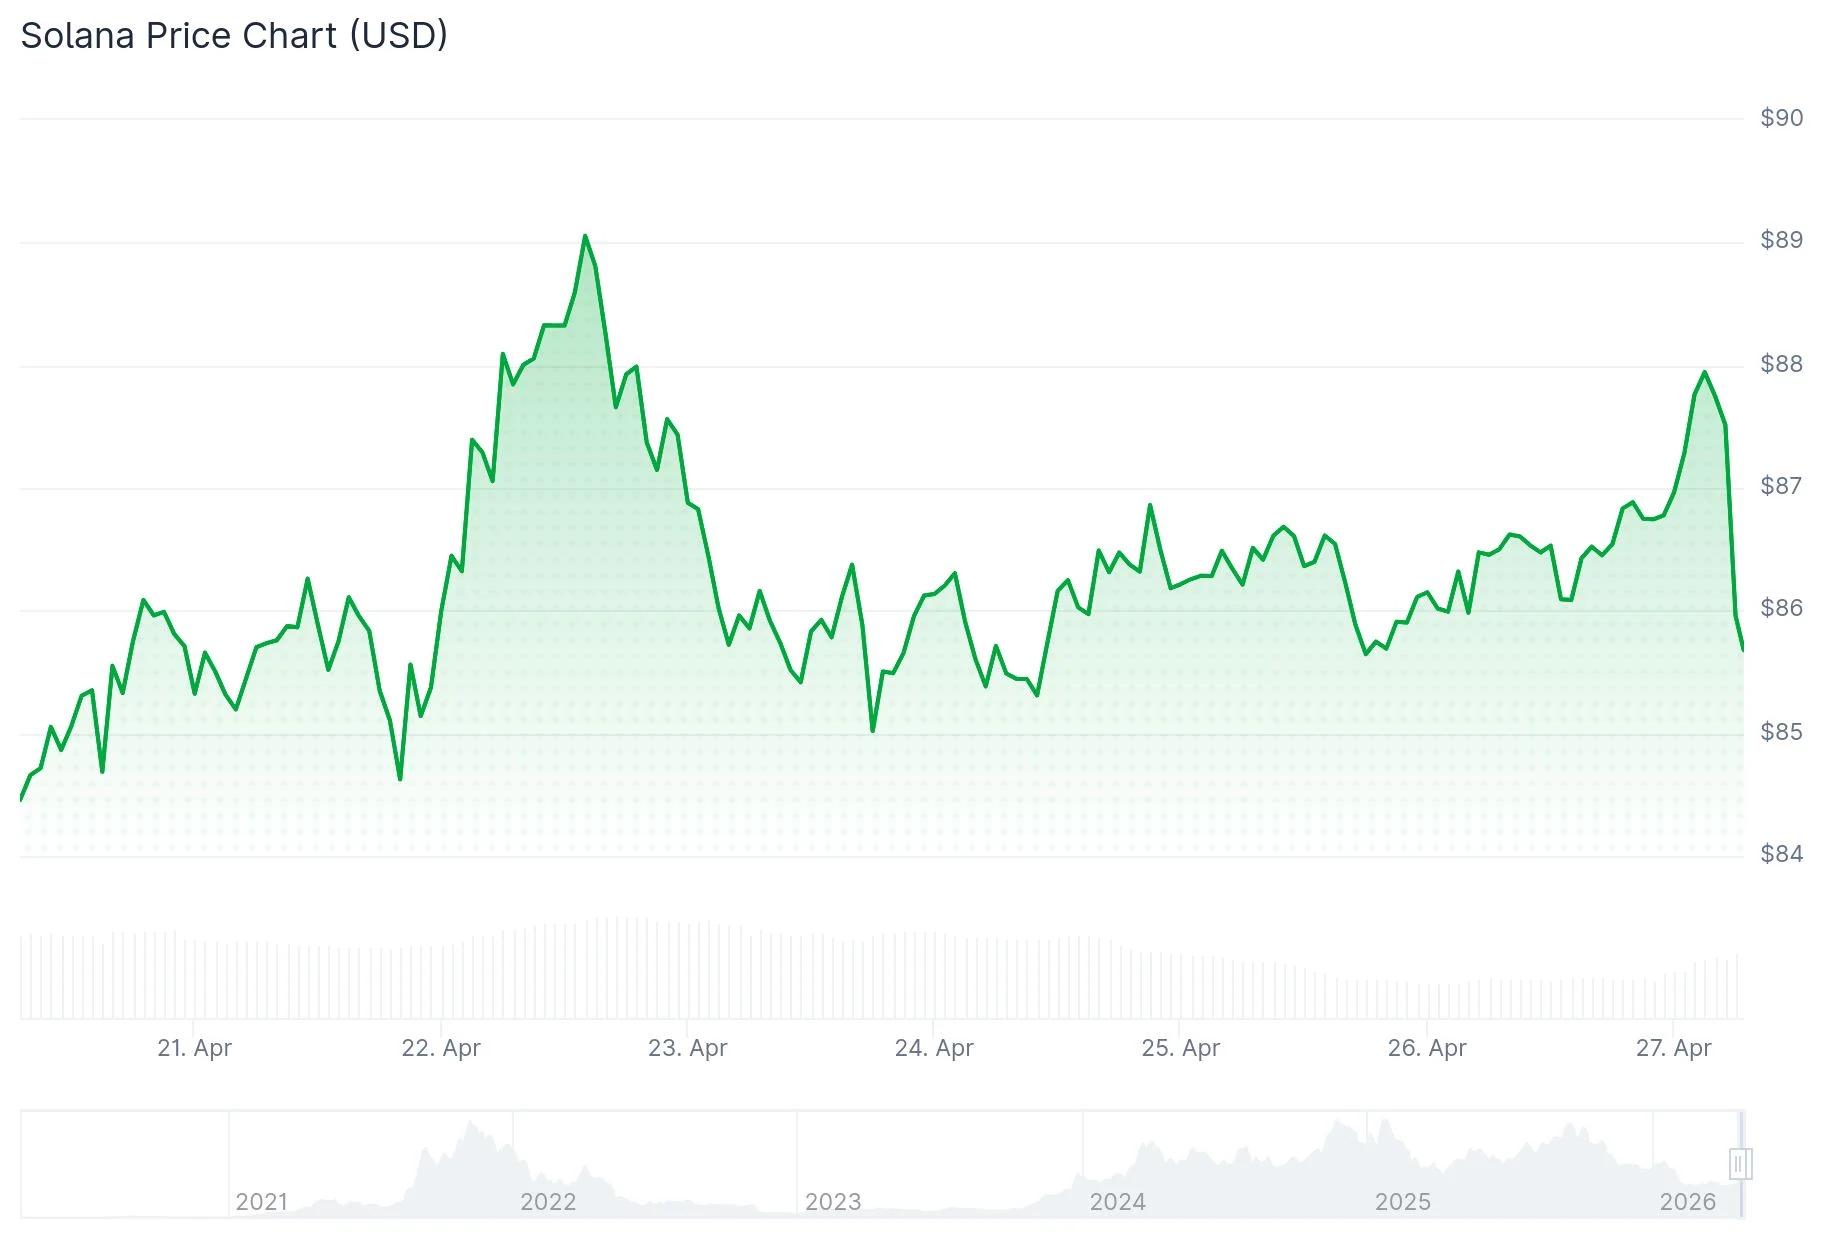
SOL successfully cleared the 50% Fibonacci retracement mark derived from the recent decline between $89.34 and $84.55. An ascending trend line has established itself with underlying support positioned at $86.50 on the hourly timeframe.
The nearest overhead barrier stands at $88.20, corresponding with the 76.4% Fibonacci retracement level. Beyond that, substantial resistance zones emerge at $90, with additional hurdles at $92.
Crypto analyst Ali Martinez emphasized that SOL currently operates within a compressed Bollinger Band corridor on the 3-day chart, confined between $77 and $94. Martinez characterized this area as a “no-trade zone,” cautioning that pursuing price movements within this range often results in whipsaw losses. According to Martinez, traders should wait for a confirmed 3-day candlestick closure beyond these bands before considering any movement as a legitimate breakout.
Trading volume has declined by more than 23% throughout this consolidation period. While reduced volume during sideways movement is typical, any breakout beyond $94 will require substantial trading activity to sustain momentum toward the $100 target.

Technical Momentum Indicators Show Emerging Strength
The Relative Strength Index (RSI) currently registers at 55, climbing above the neutral threshold on the daily timeframe. Both the MACD and its signal line have crossed into bullish territory, indicating buyers maintain current control.
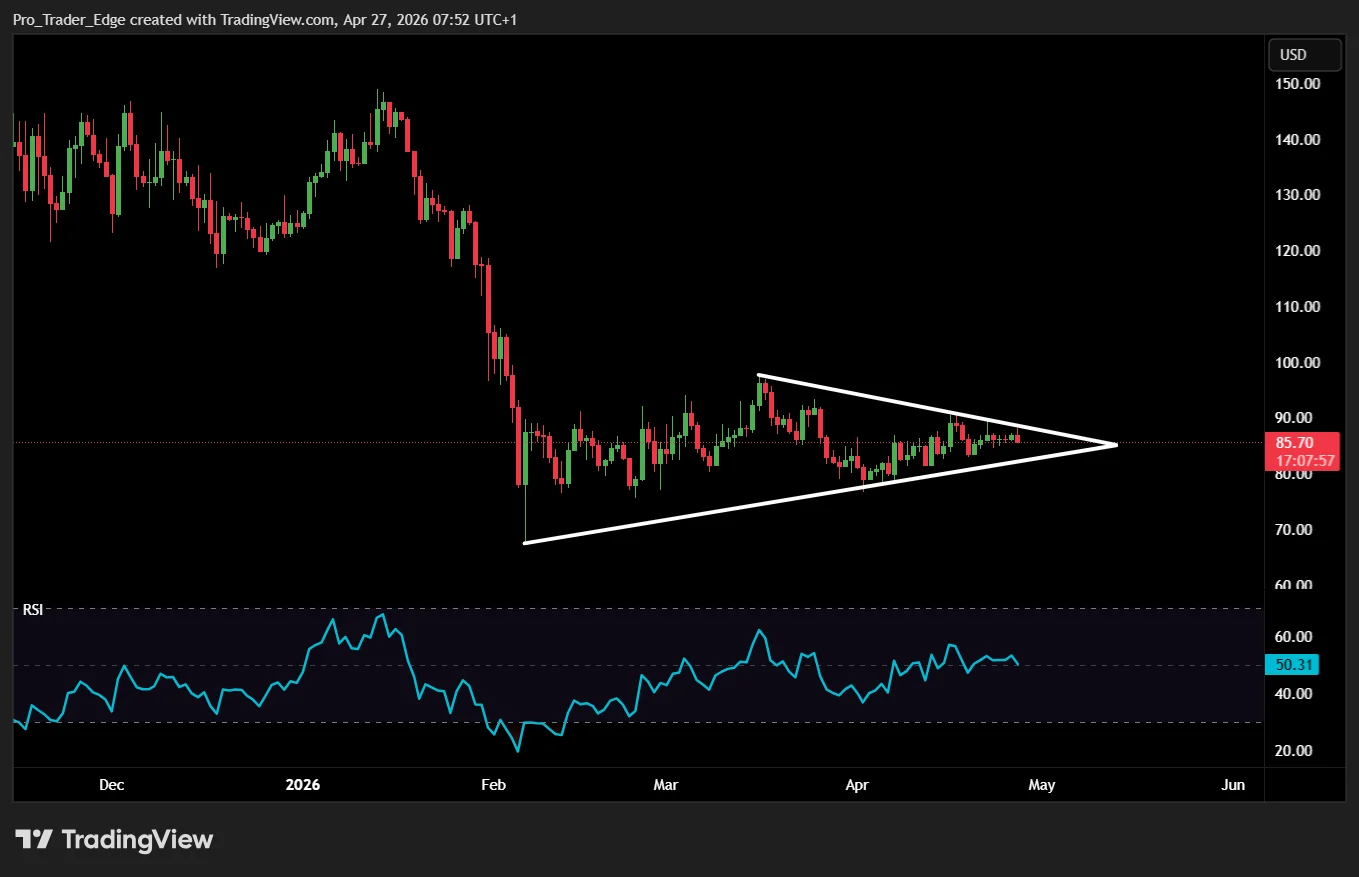
SOL is testing the upper resistance boundary of a symmetrical triangle formation near $89.00 on the daily chart. A decisive breakthrough above this threshold would open the door to the psychologically significant $100 level, followed by the 200-day EMA positioned at $113.
Regarding downside protection, the 50-day EMA at $87.04 represents the initial support layer. A daily candle closing beneath the ascending trendline near $85.99 would compromise the present bullish framework.
Institutional Participation and ETF Capital Flows
Solana-focused exchange-traded funds captured $9.44 million in net weekly capital inflows, following the previous week’s $35.17 million. A five-day consecutive streak of positive inflows has accumulated roughly $1.45 billion in total.
Goldman Sachs unveiled holdings approaching $108 million in Solana, contributing another data point to the growing institutional interest narrative that market participants are monitoring.
SOL futures Open Interest increased by over 2% within 24 hours, reaching $5.23 billion. The funding rate jumped to 0.0095%, demonstrating that traders are willing to pay elevated premiums to maintain leveraged long positions.
Should SOL fail to penetrate the $90–$94 resistance cluster, the first downside support level appears at $86.50, followed by $85. A definitive close below $78 could accelerate selling pressure toward the $72 region.
Get 3 Free Stock Ebooks
Discover top-performing stocks in AI, Crypto, and Technology with expert analysis.
- Top 10 AI Stocks - Leading AI companies
- Top 10 Crypto Stocks - Blockchain leaders
- Top 10 Tech Stocks - Tech giants

