
 Price Analysis: Will $80 Support Hold or Is $60 the Next Stop?")
Key Takeaways
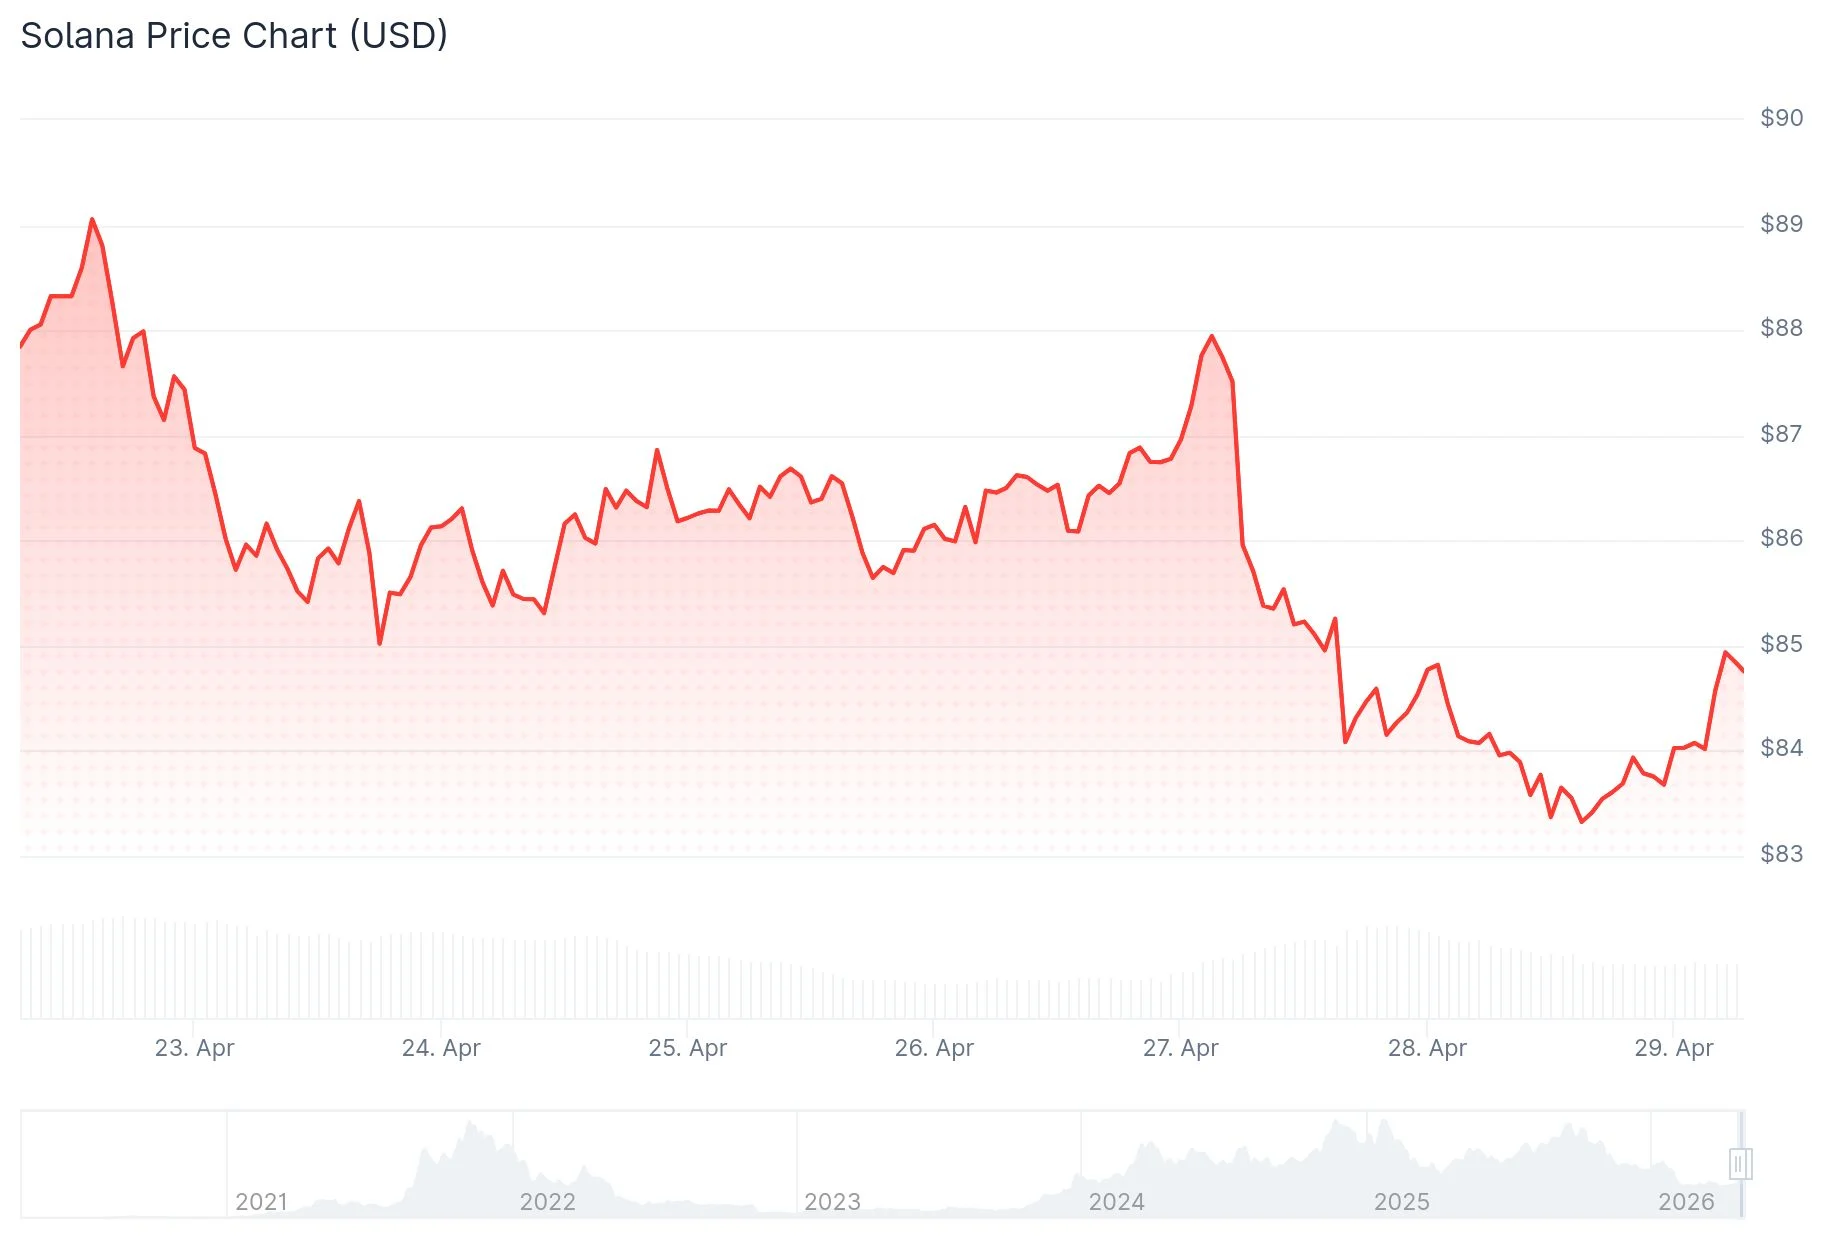
- Solana is currently hovering between $83 and $85 following a decline exceeding 3% over the past 48 hours, positioned beneath all significant moving averages.
- Technical analysis reveals a completed head and shoulders formation on longer timeframes, with the violated neckline between $110 and $120 now serving as overhead resistance.
- The $80 mark represents crucial support; failure to maintain this level could trigger declines toward $75 or $70.
- Futures market data indicates modest bullish sentiment, with a long-to-short ratio reaching 1.08 and funding rates moving into positive territory.
- Longer-term market observers identify potential accumulation opportunities in the $50 to $80 range, with optimistic forecasts reaching $500 to $1,000 if SOL successfully recaptures the $100 threshold.
Solana continues to face persistent downward pressure as April 2026 progresses. Currently priced around $84.58, the cryptocurrency remains below its 50-day, 100-day, and 200-day exponential moving averages. These technical indicators—positioned at approximately $86.72, $95.36, and $115.06 respectively—have transformed into resistance barriers.
The digital asset has shed over 3% of its value during the previous two trading sessions. Market sentiment remains uncertain, and purchasing momentum appears insufficient at these price levels.
Market analyst Crypto Tony highlighted Solana’s difficulty maintaining positions above the $85 to $88 resistance zone. The formation of successive lower highs on the price chart represents a classic indication of diminishing upward momentum. A recent rejection near $90 confirmed continued seller presence in that price region.
The $80 threshold represents the next significant support level. Should this level fail, market observers anticipate potential declines extending to $75, followed by $70.
Bearish Head and Shoulders Formation Signals Downside Risk
Market technician Mister Crypto has identified a head and shoulders pattern developing across higher timeframe charts. This formation has reached completion, with price action breaking beneath the neckline situated between $110 and $120.

This breached neckline now functions as a resistance barrier. While a retest of this zone remains plausible, rejection at that level would likely accelerate downward momentum. Potential downside targets under this scenario encompass $80 and possibly $60.
Only a decisive close above $120 would invalidate this bearish configuration and restore positive momentum for the cryptocurrency.
Futures Market Shows Modest Optimism Despite Technical Weakness
Despite lackluster price performance, certain derivatives metrics present a cautiously positive picture. According to CoinGlass data, Solana’s long-to-short ratio stands at 1.08—marking its strongest reading in more than thirty days. The open interest-weighted funding rate also transitioned to positive territory on Tuesday, registering 0.0018%. These indicators suggest traders maintain a slight preference for long positions.

Solana’s official X account announced on Tuesday that its Real World Assets ecosystem achieved a record $2.5 billion in total value. This achievement demonstrates expanding on-chain utilization, even as price action remains subdued.
Nevertheless, Santiment’s social dominance indicator for SOL dropped to merely 0.55%. Reduced social engagement typically signals waning retail enthusiasm. Exchange-traded fund flows have remained stagnant this week, with minimal institutional participation documented.
Analyst Crypto Patel adopts a broader perspective, observing that SOL has transitioned from downtrend into an extended consolidation phase. The $80 zone corresponds with a Fibonacci support threshold. Additional demand zones exist between $50 and $70, where strategic accumulation may occur. Patel anticipates a possible liquidity sweep into that range preceding any substantial upward movement. Extended-term projections suggest SOL could reach $500 or even $1,000, contingent upon a confirmed recapture of $100.
As of Wednesday’s trading session, SOL remains below the 23.6% Fibonacci retracement level at $86.67, with the RSI positioned near 48 and MACD displaying slight negativity, indicating cautious market dynamics rather than outright capitulation.
Get 3 Free Stock Ebooks
Discover top-performing stocks in AI, Crypto, and Technology with expert analysis.
- Top 10 AI Stocks - Leading AI companies
- Top 10 Crypto Stocks - Blockchain leaders
- Top 10 Tech Stocks - Tech giants

