
 Price Eyes Critical $86 Resistance as Bulls Gain Momentum")
TLDR
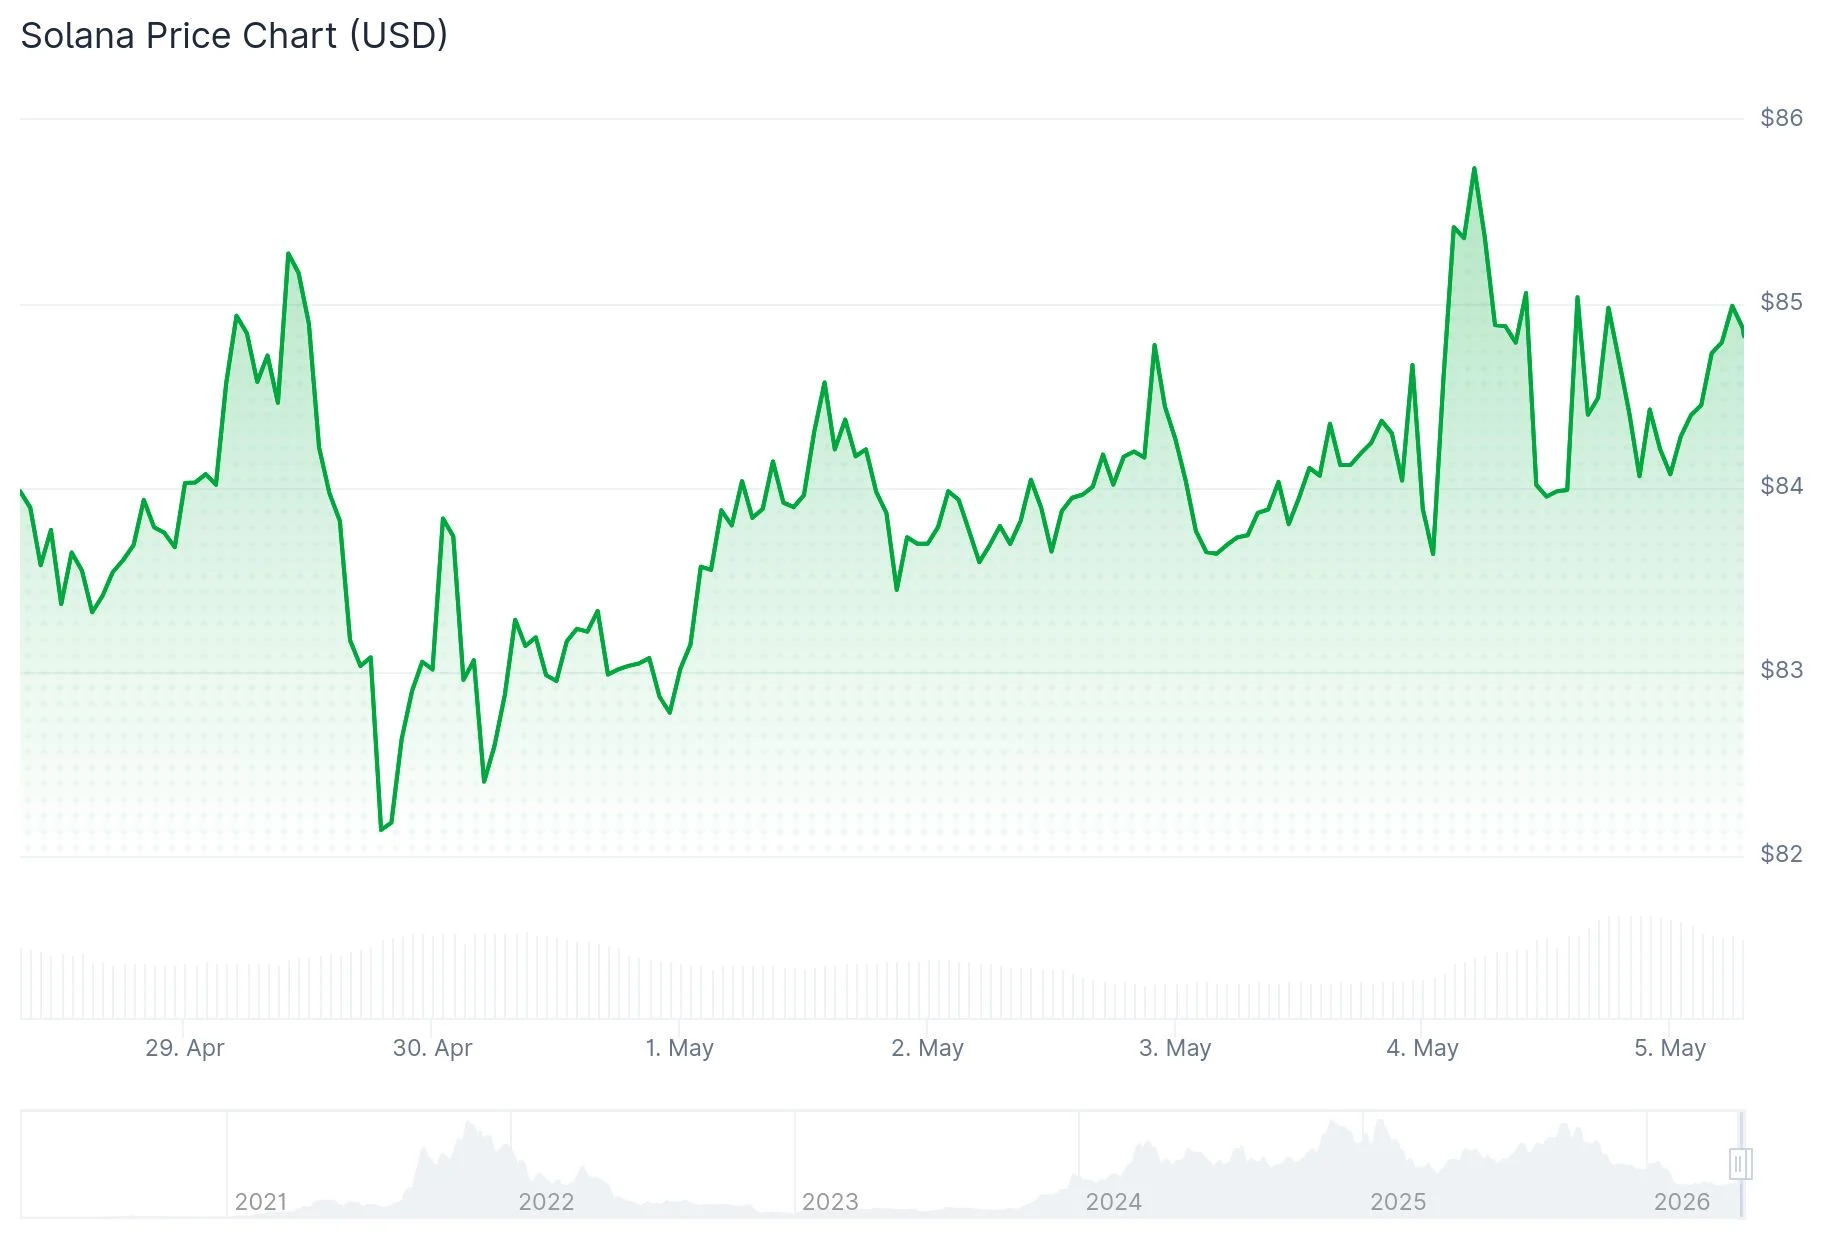
- Solana is currently priced at approximately $84.94, showing a 1.32% gain over 24 hours, with market capitalization approaching $48.96 billion.
- Breaking above the 50-day EMA positioned at $86.10 represents the critical resistance bulls must overcome for momentum reversal.
- The cryptocurrency has remained beneath the $100 threshold for 90 consecutive days, marking the longest duration since 2020.
- On-chain payment volume for Solana exceeded $10 billion during Q1 2026, demonstrating robust network utilization despite sluggish price performance.
- Spot ETF products attracted $3.28 million in fresh capital on Monday, marking the initial inflows since late April and indicating renewed institutional appetite.
Solana (SOL) continues to consolidate around the $85 mark on Tuesday as market participants monitor whether buying pressure can overcome a crucial technical obstacle. Currently changing hands at roughly $84.94, the token has registered a 1.32% advance over the preceding 24-hour period, maintaining a market capitalization near $48.96 billion alongside daily trading volume of $3.05 billion.
The immediate challenge confronting bulls is the 50-day Exponential Moving Average (EMA) currently positioned at $86.10. SOL has repeatedly failed to establish sustained movement above this technical marker, maintaining downward pressure on price action.
The $86–$88 range has consistently rejected upward momentum during recent rally attempts. Without a decisive close above this resistance zone, each upward move risks creating another descending peak. Compounding this challenge is the 23.6% Fibonacci retracement level at $86.67, which adds additional selling pressure.
Market analyst CryptoJack highlighted on X that SOL has been unable to recapture the 50 EMA, while a previously supportive ascending trendline has lost its effectiveness following a breakdown. Bulls must now reclaim both the trendline and the 50 EMA to generate a meaningful shift in market sentiment.
Momentum indicators present a mixed picture. The Relative Strength Index (RSI) sits near the neutral 50 level, while the MACD remains marginally below zero. These readings indicate diminishing selling pressure without confirming strong buyer commitment.

ETF Inflows and Derivatives Data Hint at Improving Sentiment
Institutional metrics provided a modest bullish signal. Solana spot ETF products captured $3.28 million in net inflows on Monday, per SoSoValue data. This marked the first positive flow since April 23. Sustained inflows throughout the week could offer meaningful buying support.

In derivatives markets, the long-to-short ratio for SOL on CoinGlass climbed to 1.12 on Tuesday, representing the highest reading observed in more than 30 days. When this ratio exceeds one, it signals that more market participants are betting on price appreciation rather than decline, suggesting cautiously optimistic positioning.
CryptoQuant analytics reveal stabilizing conditions in spot markets alongside buy-side preference in futures trading, with most other indicators showing neutral territory.
On-Chain Activity Stays Strong Despite Price Weakness
Despite lackluster price performance, Solana’s network fundamentals remain resilient. Trader Symba published data on X demonstrating that Solana’s on-chain payment transactions reached approximately 10.1 billion during Q1 2026, crossing the $10 billion threshold.
Such elevated network engagement rarely coincides with genuinely deteriorating fundamentals. This disconnect between vigorous on-chain utilization and subdued price movement has been identified by market observers as a potentially constructive factor should demand resurface.
Solana has now recorded 90 straight days trading beneath $100, representing the most extended period since 2020, according to analyst shah on X. The $100 level now functions as a significant psychological milestone. Successfully breaching this level would signal an exit from an extended consolidation pattern.
On the support side, the $83–$84 zone provides immediate downside protection. A breakdown below this area could drive SOL toward the $80–$78 range.
The long-to-short ratio reaching its highest point in over a month stands as the most recent indicator suggesting recovering trader confidence.
Get 3 Free Stock Ebooks
Discover top-performing stocks in AI, Crypto, and Technology with expert analysis.
- Top 10 AI Stocks - Leading AI companies
- Top 10 Crypto Stocks - Blockchain leaders
- Top 10 Tech Stocks - Tech giants

