
 Revisits Critical Support Zone That Ignited 2,200% Rally Previously")
TLDR
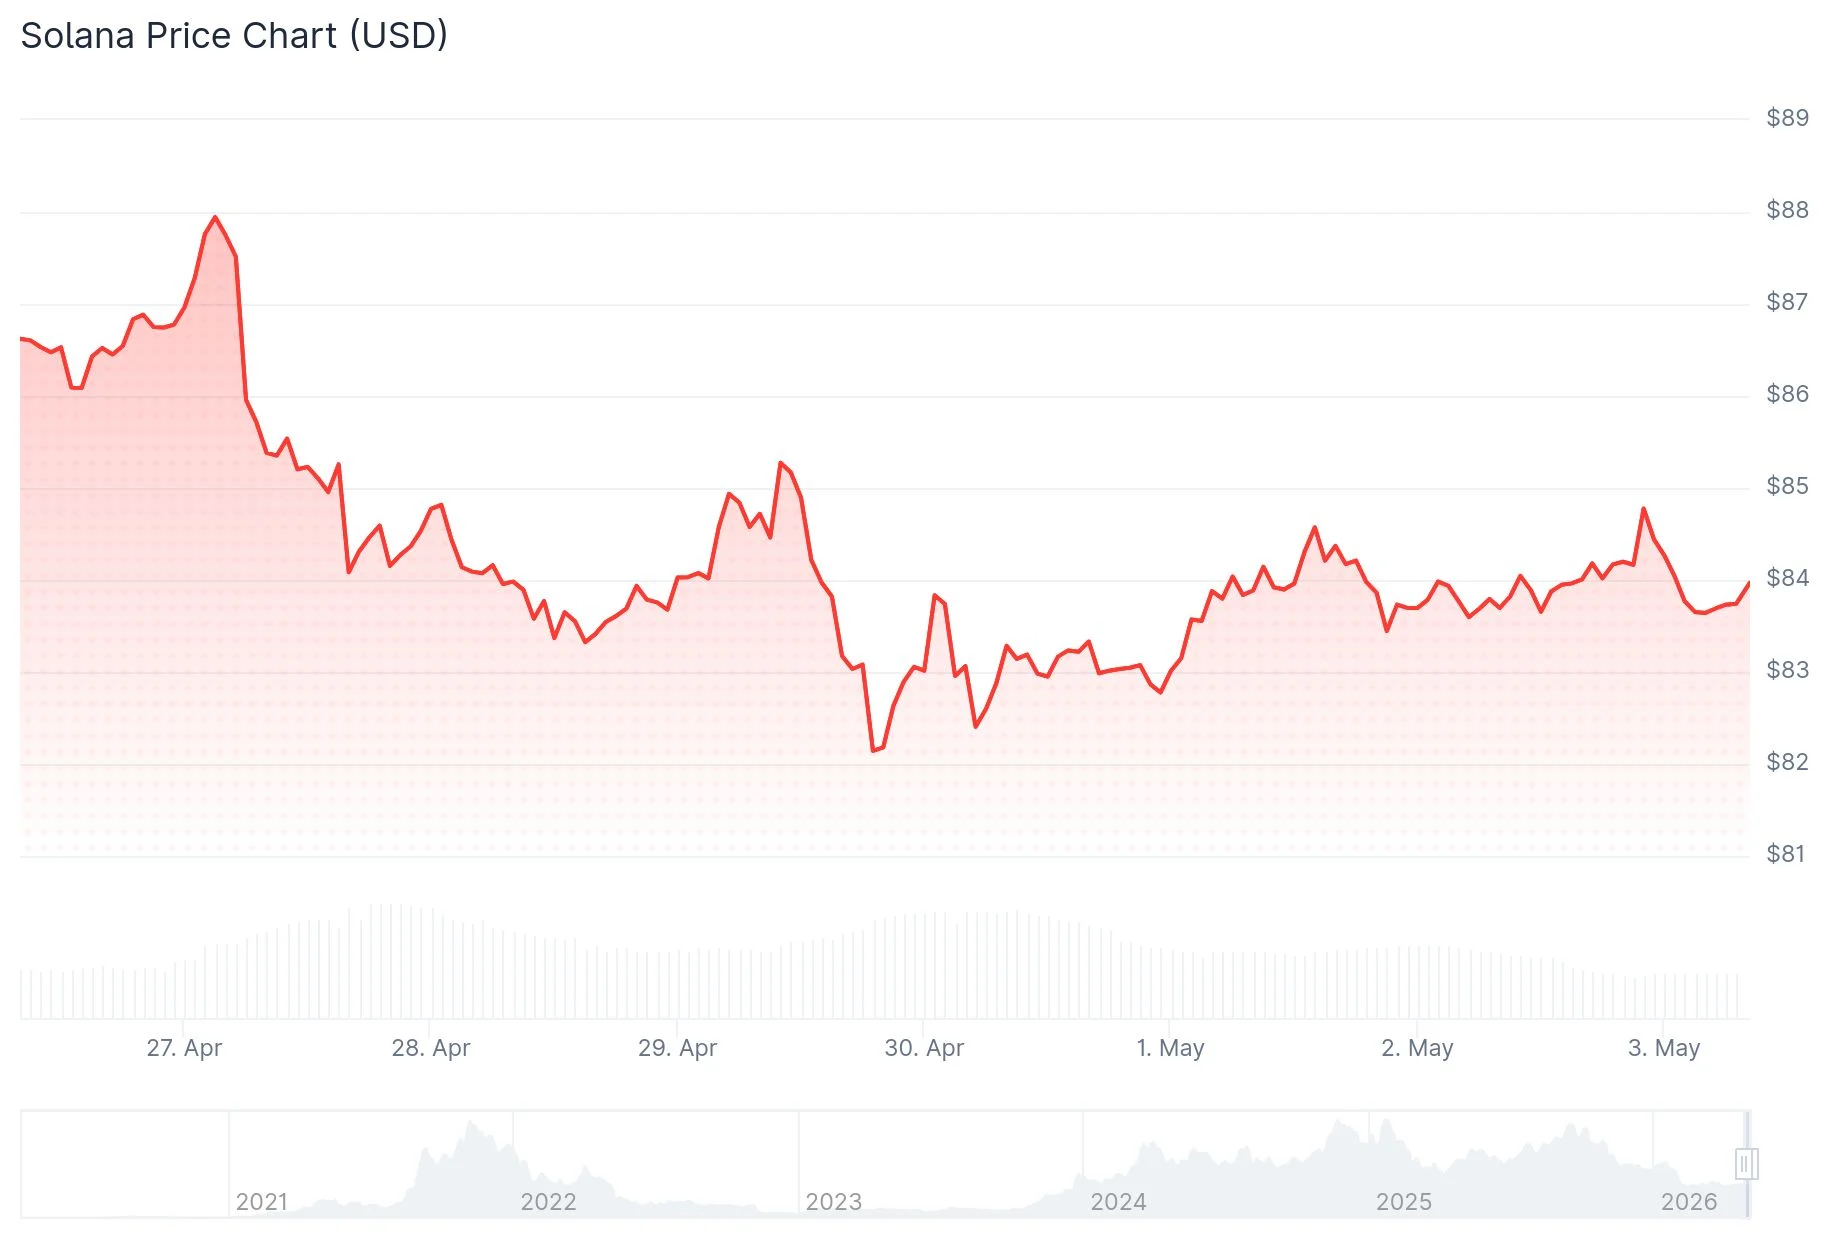
- SOL currently trades within the $80–$85 range, a historically significant accumulation area that preceded major price expansions.
- Liquidation data reveals concentrated short positions clustered between $84 and $87.
- Bulls must reclaim $106.24 to confirm renewed upward momentum.
- Crypto analyst Patel highlights SOL’s return to the identical price zone that preceded a 2,200% surge during the previous cycle.
- Technical charts display a compressing triangle formation with potential breakout targets ranging from $250 to $300 if support maintains.
Solana currently fluctuates within the $80 to $85 corridor as of this writing, a critical price territory that has historically influenced major directional moves across previous market cycles. The digital asset experienced a decline exceeding 70% from its 2025 peak before settling back into this familiar range.
This price level represents familiar ground for SOL. During 2021, the asset surged from single-digit dollar values beyond $250. Following significant drawdowns throughout 2022 that brought prices near $10, the token reconstructed its foundation and subsequently climbed to fresh peaks approaching $290 in the following cycle.
Prominent analyst Crypto Patel on X platform directly addressed this recurring pattern. In his recent commentary, Patel stated: “$SOL is back at the same buy zone that pumped it 2,200% last cycle. Will it hit $1000 in alt season?” His observation identifies a cyclical behavior where this specific price territory has consistently functioned as a foundation for substantial upward movements.
Critical Price Thresholds Under Surveillance
Liquidation analytics from CoinAnk reveal accumulating short exposure within the $84 to $87 territory. Price action briefly touched approximately $81 before recovering toward the upper concentration zone. These heatmaps illustrate price levels where leveraged traders face potential forced liquidations upon reaching specific thresholds.
Market observer Don presented charting analysis identifying $106.24 as the critical resistance SOL must overcome. Until price action successfully breaches this threshold, technical indicators do not signal a definitive bullish trend reversal. Beyond $106, extended projections target $260.17, though this objective remains considerably distant under current conditions. Should buyers lose control of present support, technical projections suggest potential retracement toward $80 or deeper levels.

Converging Triangle Formation Builds Tension
Technical analyst Javon Marks presented charting evidence displaying SOL confined within an expansive triangle consolidation pattern. This formation demonstrates progressively descending peaks and ascending troughs developing across an extended timeframe, traditionally compressing price action before significant directional resolution.
Solana presently trades near the triangle’s lower boundary, approximately within the $75 to $85 range. If purchasing pressure successfully defends this support structure, breakout projections estimate targets between $250 and $300. Conversely, a decisive breakdown beneath the mid-$60 region would invalidate the bullish pattern and potentially expose the $45 zone.
Currently, SOL maintains position within its established support corridor between $80 and $90, with $106.24 standing as the primary resistance level bulls must conquer to confirm momentum reversal.
Get 3 Free Stock Ebooks
Discover top-performing stocks in AI, Crypto, and Technology with expert analysis.
- Top 10 AI Stocks - Leading AI companies
- Top 10 Crypto Stocks - Blockchain leaders
- Top 10 Tech Stocks - Tech giants

