

Key Takeaways
- XRP continues to test critical $1.40 support as bearish signals emerge on shorter timeframes
- Technical analysis reveals a descending triangle formation with MACD showing negative divergence
- The Relative Strength Index has declined to 40, signaling diminishing bullish momentum
- Institutional demand remains evident with XRP ETF products recording $15.74M–$25M in weekly capital inflows
- Market analyst Ali Charts suggests XRP is positioned for significant volatility, with $1.30 potentially marking the cycle low
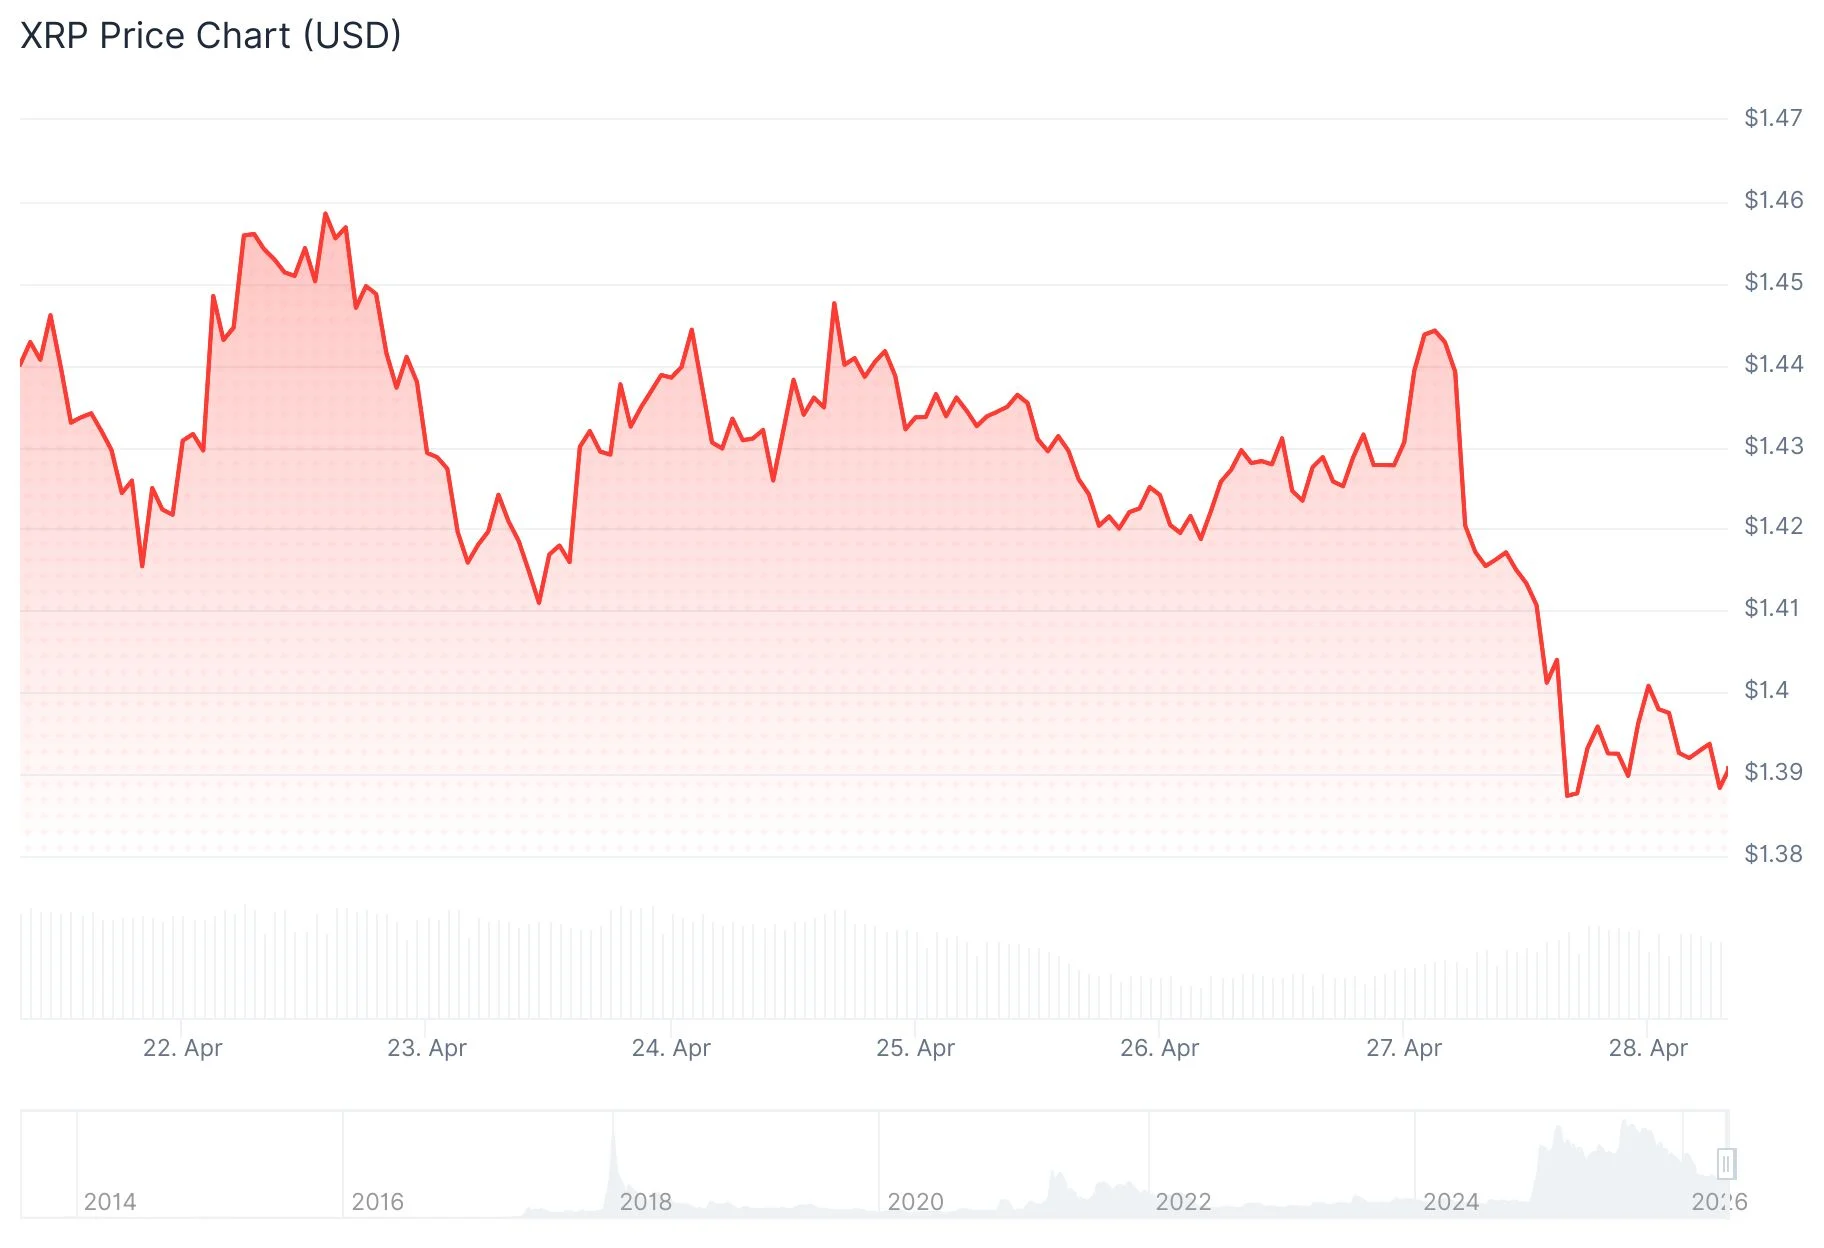
XRP currently trades in the vicinity of $1.40 following an inability to sustain earlier weekly advances. The digital asset faces mounting selling pressure as bearish participants reassert dominance and technical indicators deteriorate.
Technical examination of the 4-hour timeframe reveals the development of a descending triangle configuration. This chart structure consists of successive lower peaks converging toward horizontal support. Such formations typically signal potential downside continuation should the floor level fail.
The Moving Average Convergence Divergence indicator has generated a bearish crossover beneath its signal line. Expanding red bars on the histogram confirm accelerating downward momentum. Meanwhile, the RSI has retreated to approximately 40, reflecting deteriorating demand from buyers.
The $1.40 threshold has endured multiple challenges throughout recent trading periods. Persistent retests of support zones typically erode their effectiveness, elevating the probability of a decisive breach.
Should XRP penetrate below $1.40, subsequent support zones emerge at $1.38, followed by $1.36, with $1.34 representing a deeper target if liquidation pressure intensifies.

Critical Overhead Resistance Points
For bullish reversal scenarios, market participants must first recapture $1.43. A more formidable obstacle exists at $1.45, which aligns with the upper boundary of the descending trendline. Successful penetration above $1.45 would establish a pathway toward $1.50.
Over the trailing 30-day window, Bitcoin and Ethereum have delivered returns of 17% and 16% respectively. XRP has generated merely 5% during this identical timeframe, demonstrating that capital continues flowing toward perceived quality assets.
Crypto analyst Ali Charts shared on X that “$XRP is ready for a big price move,” although the commentary omitted specific directional forecasts or precise targets.
One market observer highlighted that XRP’s weekly RSI contracted to 30 during early March. Historical precedent shows that the three prior occasions when the RSI compressed below 33, XRP subsequently generated appreciation ranging from 226% to 1,460% in following months.
Drawing upon this historical correlation, analysts at FX Empire suggest the cyclical floor may already be established at $1.30. Their framework projects a potential advance to $1.50 as an initial objective, with $1.65 representing the subsequent target.
Institutional Demand Through XRP ETFs Continues
Exchange-traded products linked to XRP accumulated between $15.74 million and $25 million during the previous week, with variance attributable to different tracking methodologies. Cumulative year-to-date capital inflows for XRP ETFs have now reached $148 million.
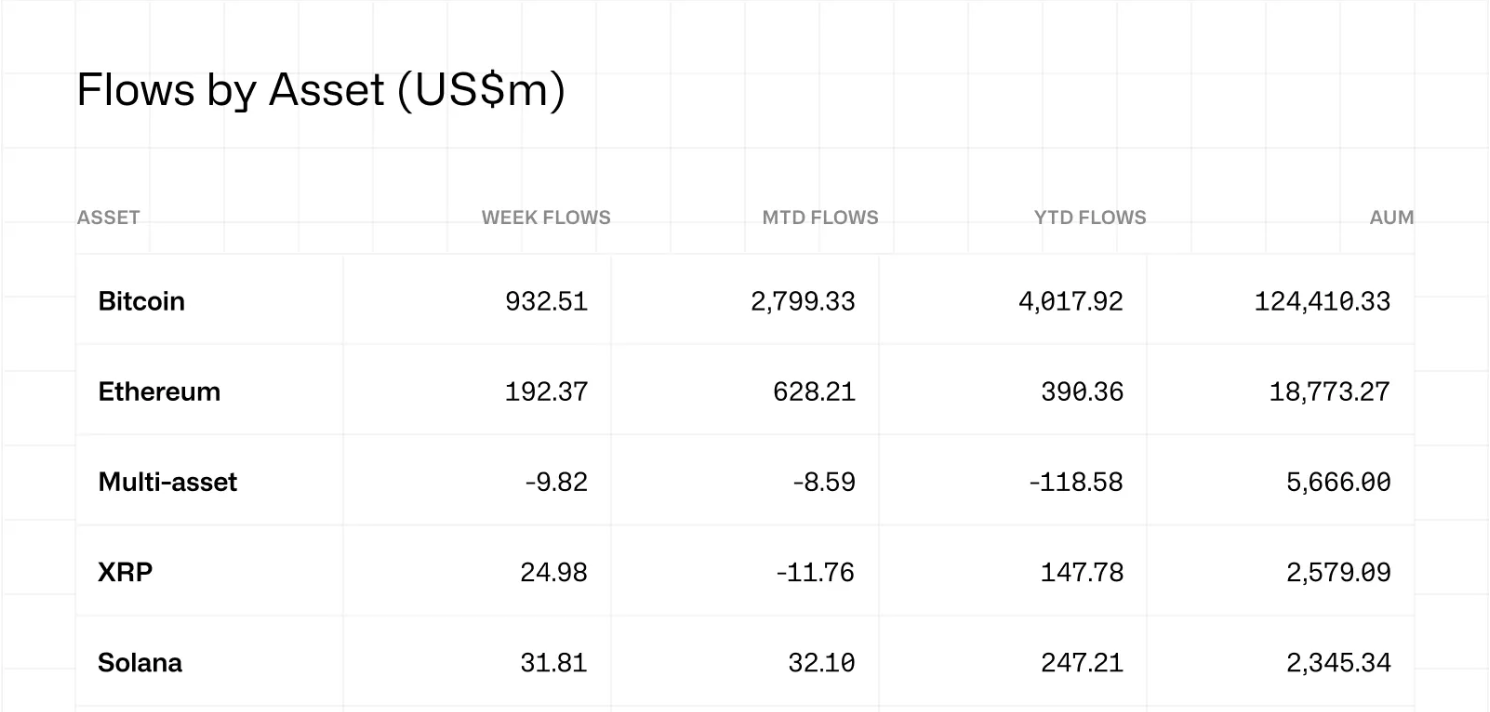
Bitcoin-focused ETFs dominated cryptocurrency investment vehicles with $824 million in weekly inflows, extending a positive streak to four consecutive weeks. Ethereum ETFs captured $155 million, while Solana-based funds attracted $9.44 million.
The comprehensive crypto ETP marketplace recorded $1.2 billion in aggregate inflows for the week, according to data from CoinShares. The Crypto Fear and Greed Index presently registers 44, representing a decline from its recent peak of 62.
The upcoming FOMC policy meeting scheduled for April 28 remains a focal point for market participants. Consensus expectations anticipate unchanged rates, with strategists projecting an absence of rate reductions throughout the remainder of the year.
Get 3 Free Stock Ebooks
Discover top-performing stocks in AI, Crypto, and Technology with expert analysis.
- Top 10 AI Stocks - Leading AI companies
- Top 10 Crypto Stocks - Blockchain leaders
- Top 10 Tech Stocks - Tech giants

