

Quick Overview
- XRP currently trades between $1.43 and $1.45, posting approximately 1.2% gains over the past day
- Critical resistance zone identified at $1.44–$1.50, while support maintains strength near $1.35
- Technical analysts spot developing Gartley harmonic formation pointing toward $2.64 price objective
- Symmetrical triangle consolidation pattern on daily timeframe suggests explosive move approaching
- Market analyst EGRAG CRYPTO identifies $2.30 as preliminary upside objective following resistance breakthrough
Ripple’s XRP token remains confined within a tight trading corridor while significant technical formations develop, prompting market watchers to monitor for potential volatility.
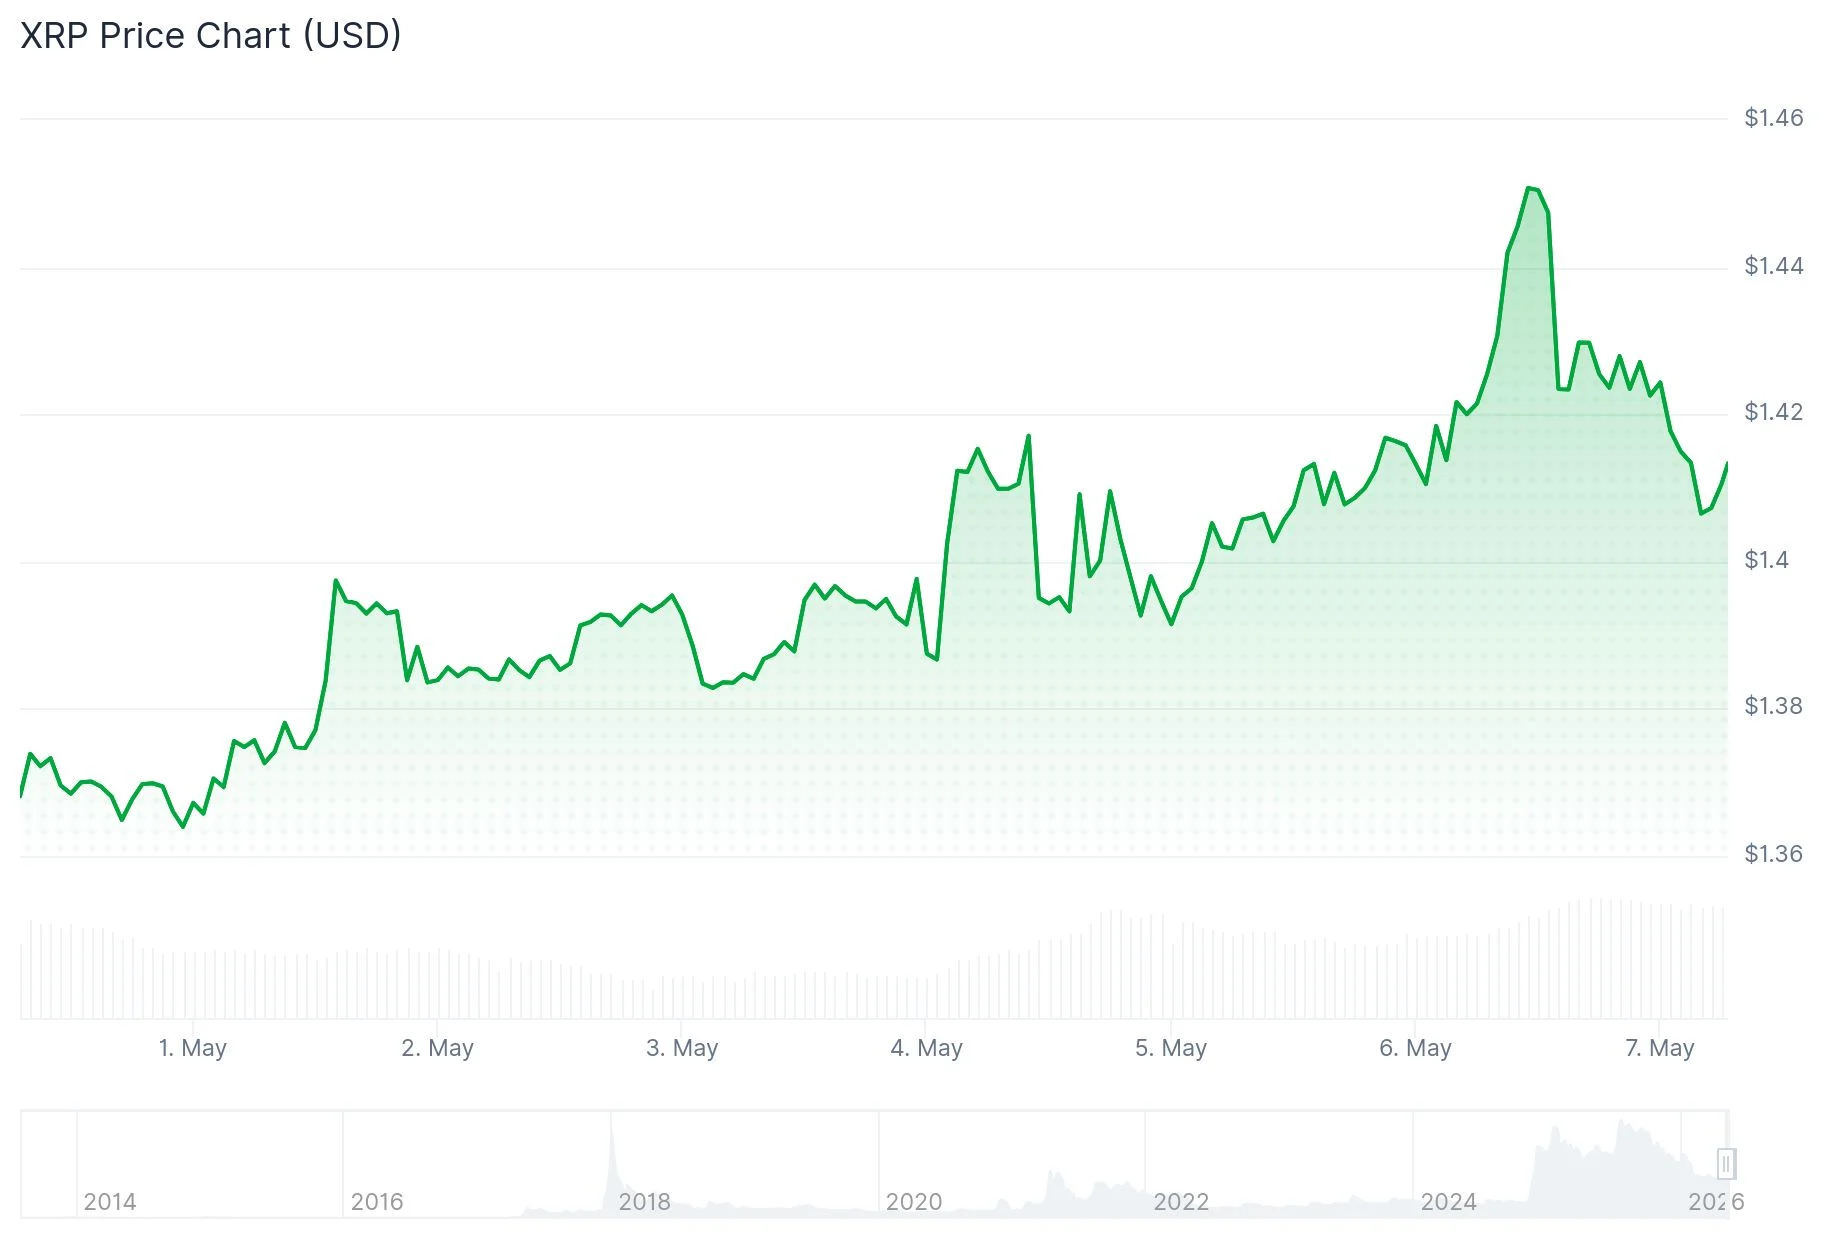
XRP, recognized for facilitating rapid international transactions with minimal transfer costs, currently fluctuates within the $1.43–$1.45 corridor. While the latest 24-hour period brought modest upward movement of roughly 1.2%, the developing technical formations present the more compelling narrative.
The digital asset has maintained position above the middle Bollinger Band throughout its recent daily chart action. This technical level continues providing dynamic price support, maintaining bullish market structure for the time being. Immediate overhead resistance emerges at the upper Bollinger Band boundary between $1.46 and $1.47.
Momentum indicators via MACD demonstrate gradual strengthening. Though a definitive bullish signal hasn’t materialized yet, preliminary indications of positive momentum divergence are emerging. Current trading volumes hover at moderate levels—a characteristic market technicians often interpret as accumulation phase behavior rather than distribution.
Harmonic Formation Suggests Substantial Upside Potential
Technical chartist The_Alchemist_Trader_ has identified a developing Gartley harmonic structure within XRP’s price action. This formation approaches its concluding C-D leg completion, and upon validation, projects an upside objective approaching $2.64. The analyst emphasized: “The harmonic structure is approaching its final phase, and holding the current support zone is critical for continuation.” Should price action violate current support parameters, this technical scenario would face complete invalidation.

In parallel analysis, cryptocurrency trader EGRAG CRYPTO highlighted a contracting symmetrical triangle formation visible on daily chart intervals. Such consolidation structures typically precede significant directional price movements. EGRAG CRYPTO observed this configuration “could lead to a strong breakout once macro resistance levels are cleared,” establishing a preliminary upside target around $2.30. Market participants should remain alert for potential false breakout scenarios where price briefly surges before reversing.
Critical Price Zones Under Surveillance
The $1.44–$1.50 boundary has functioned as persistent overhead supply territory. A decisive daily close surpassing this region would establish pathway toward initial resistance at $1.60, potentially unlocking access to higher price objectives thereafter. Conversely, the $1.35 level represents crucial demand support. Failure to maintain this threshold could trigger downward pressure toward $1.32.
The Relative Strength Index currently registers near 57—indicating neither overbought nor oversold conditions. Short-term moving averages display bullish configuration, though broader oscillator readings maintain neutral positioning. Chart patterns reveal a “Change of Character” formation on daily intervals, suggesting potential trend transition without yet confirming ultimate direction.
Regarding fundamental catalysts, Ripple continues announcing expanded participation in tokenized asset initiatives and institutional cross-border payment solutions through the XRP Ledger. While these developments bolster longer-term market confidence, their capacity to generate immediate price action remains limited.
At current market prices, XRP trades at approximately $1.45, positioned just beneath the pivotal $1.46–$1.47 resistance boundary.
Get 3 Free Stock Ebooks
Discover top-performing stocks in AI, Crypto, and Technology with expert analysis.
- Top 10 AI Stocks - Leading AI companies
- Top 10 Crypto Stocks - Blockchain leaders
- Top 10 Tech Stocks - Tech giants

