
 Enters Critical Compression Zone Before Potential Breakout")
Key Highlights
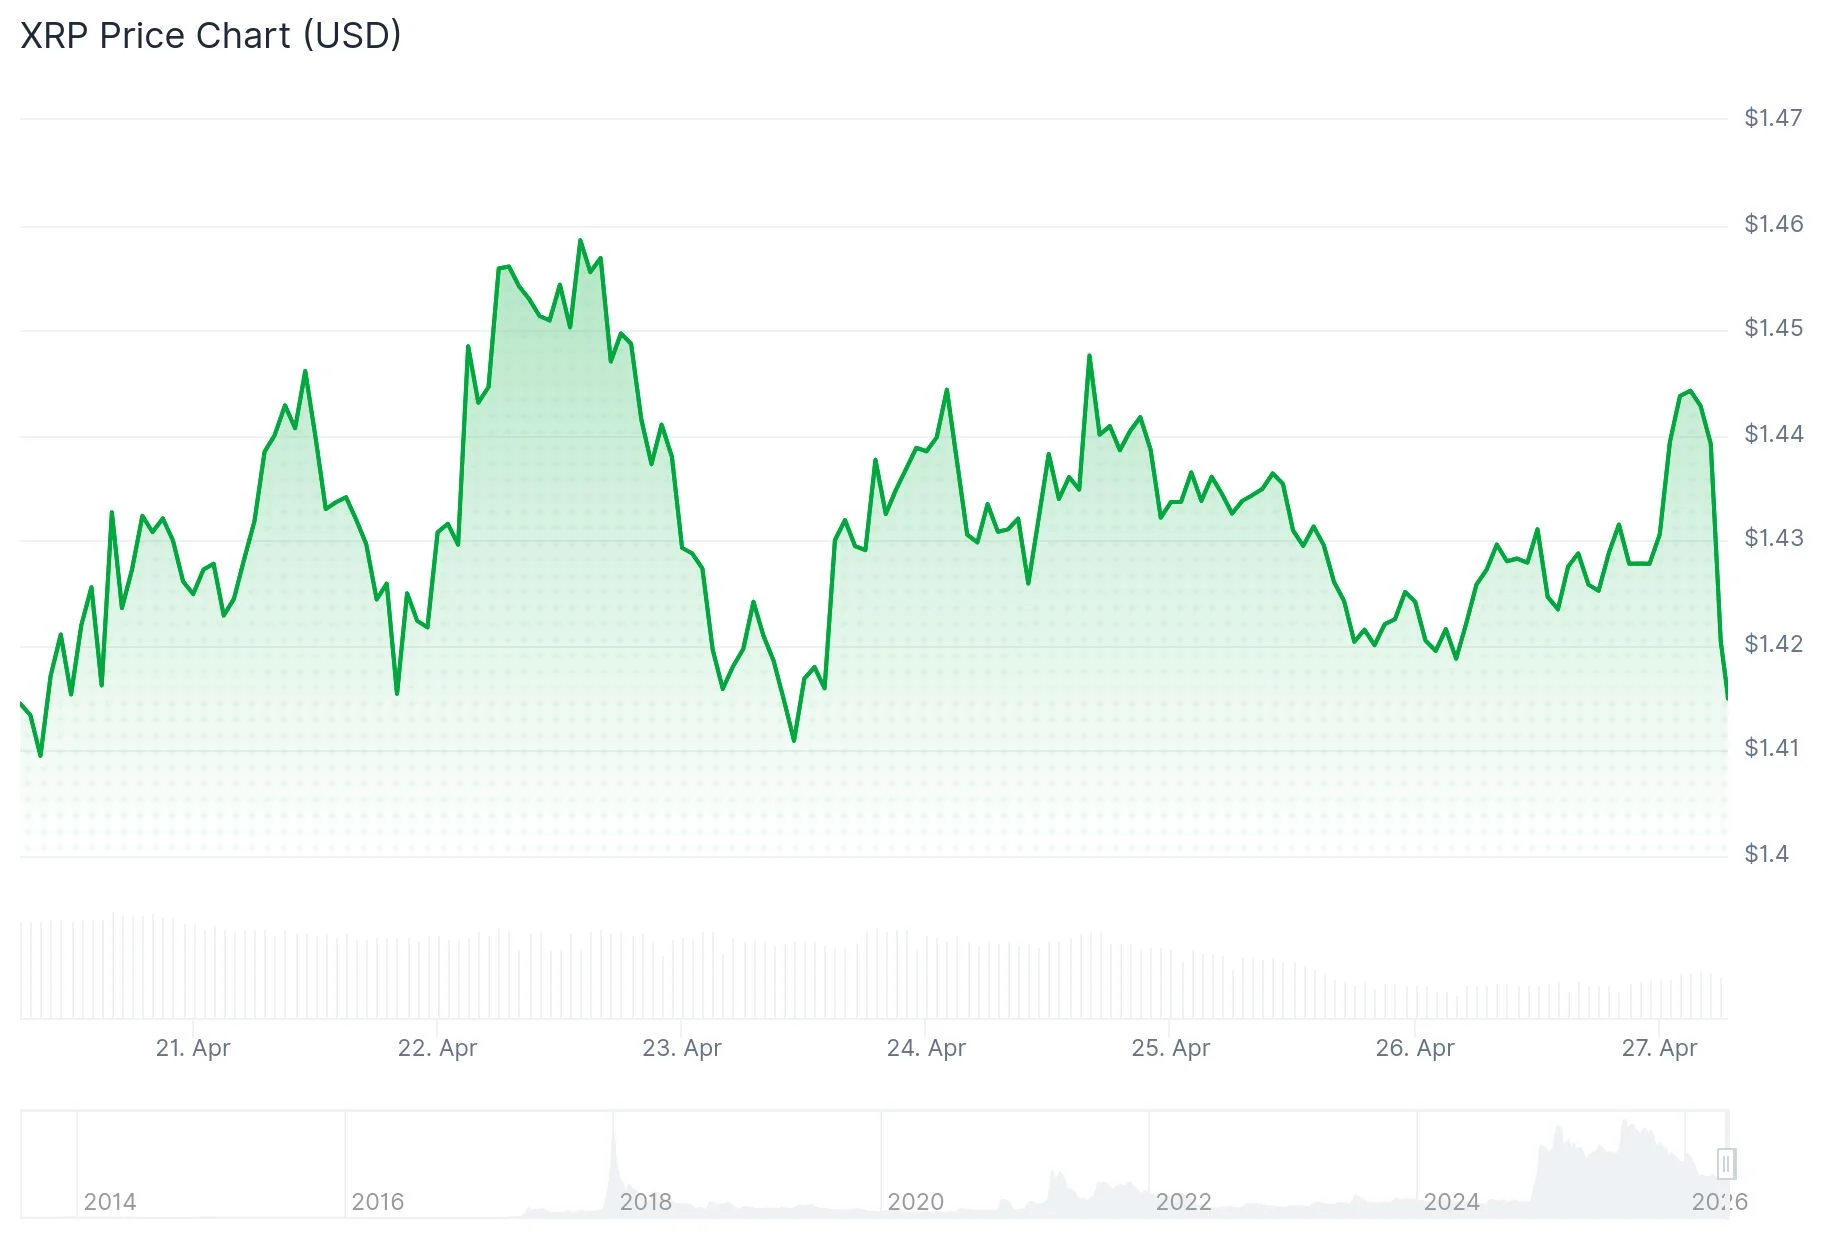
- XRP currently trades at $1.42 with $87.93 billion market capitalization and 24-hour trading volume of $1.09 billion
- Current price action shows consolidation near both 20-day and 50-day exponential moving averages in compression formation
- Relative Strength Index positioned at 54–55 range, indicating neutral momentum with slight bullish bias
- Breakout above $1.45–$1.50 resistance zone could trigger rally toward $3.00 price target
- Loss of $1.10 support level may result in decline toward $0.90
XRP maintains its position at $1.42, demonstrating stability throughout the past week without significant directional bias. The cryptocurrency has recorded $1.09 billion in 24-hour trading activity, representing approximately a 4% decline from the previous period.
With a market capitalization of $87.93 billion remaining relatively unchanged, the token appears to be in a consolidation phase rather than experiencing aggressive accumulation or distribution.
Crypto analyst EGRAG CRYPTO highlighted an interesting behavioral shift among traders, who are increasingly analyzing line charts instead of traditional candlestick formations. This approach eliminates intraday volatility and provides clearer visibility into longer-term directional trends.
EGRAG CRYPTO’s analysis identifies XRP forming a compression structure — characterized by descending peaks meeting established support levels. Such technical formations frequently precede significant price expansions following re-accumulation periods.
The monthly chart shows the 50-period exponential moving average currently providing support. EGRAG CRYPTO also mentioned the possibility of a brief downward spike toward the 100 EMA before any substantial expansion phase materializes.

Near-Term Chart Analysis
Examining the hourly timeframe, XRP recently tested $1.4471 before experiencing modest retracement. Price action continues holding above the 100-hour Simple Moving Average alongside a bullish trendline offering support around $1.4320.
Multiple shorter-duration exponential moving averages — including the 10, 20, 30, and 50-period EMAs — remain positioned beneath current price levels while generating bullish signals. This configuration indicates buyers are actively absorbing dips at lower price points.
The primary resistance barrier is located at $1.45. Successfully breaching this threshold could establish pathways toward $1.4650, followed by $1.4840, with $1.50 representing the next psychological level. Beyond that, $1.5150 emerges as the subsequent critical resistance zone.
Regarding downside protection, initial support emerges at $1.44, with $1.4320 serving as the secondary defense level. A definitive close beneath $1.4320 would likely activate $1.4050 and $1.40 as next support targets.
Indicator Signals and Critical Price Levels
The Relative Strength Index currently reads between 54–55, positioned above neutral territory following recovery from oversold conditions observed during February. The Moving Average Convergence Divergence indicator has produced a modest bullish signal, though technical analysts note it lacks sufficient strength to validate an imminent breakout.
Additional momentum oscillators such as the stochastic RSI and commodity channel index remain positioned near neutral zones. This convergence of balanced technical readings suggests the market is awaiting a catalyst.
The primary pivot point is established near $1.41. Resistance overhead begins at $1.51, extending to higher targets at $1.72 and $2.04. Downside support initiates at $1.22, with deeper protection zones identified at $1.10 and $0.90.
XRP is presently maintaining position slightly above the $1.41–$1.43 pivot range, which market analysts consider decisive for determining the token’s next significant directional movement.
Get 3 Free Stock Ebooks
Discover top-performing stocks in AI, Crypto, and Technology with expert analysis.
- Top 10 AI Stocks - Leading AI companies
- Top 10 Crypto Stocks - Blockchain leaders
- Top 10 Tech Stocks - Tech giants

