
 Battles to Maintain $80K Level as US Inflation Surges to Three-Year Peak")
Key Takeaways
- April’s US CPI climbed to 3.8% annually, marking the steepest rate since May 2023
- Rising energy costs, fueled by US-Iran tensions, contributed more than 40% to the monthly inflation surge
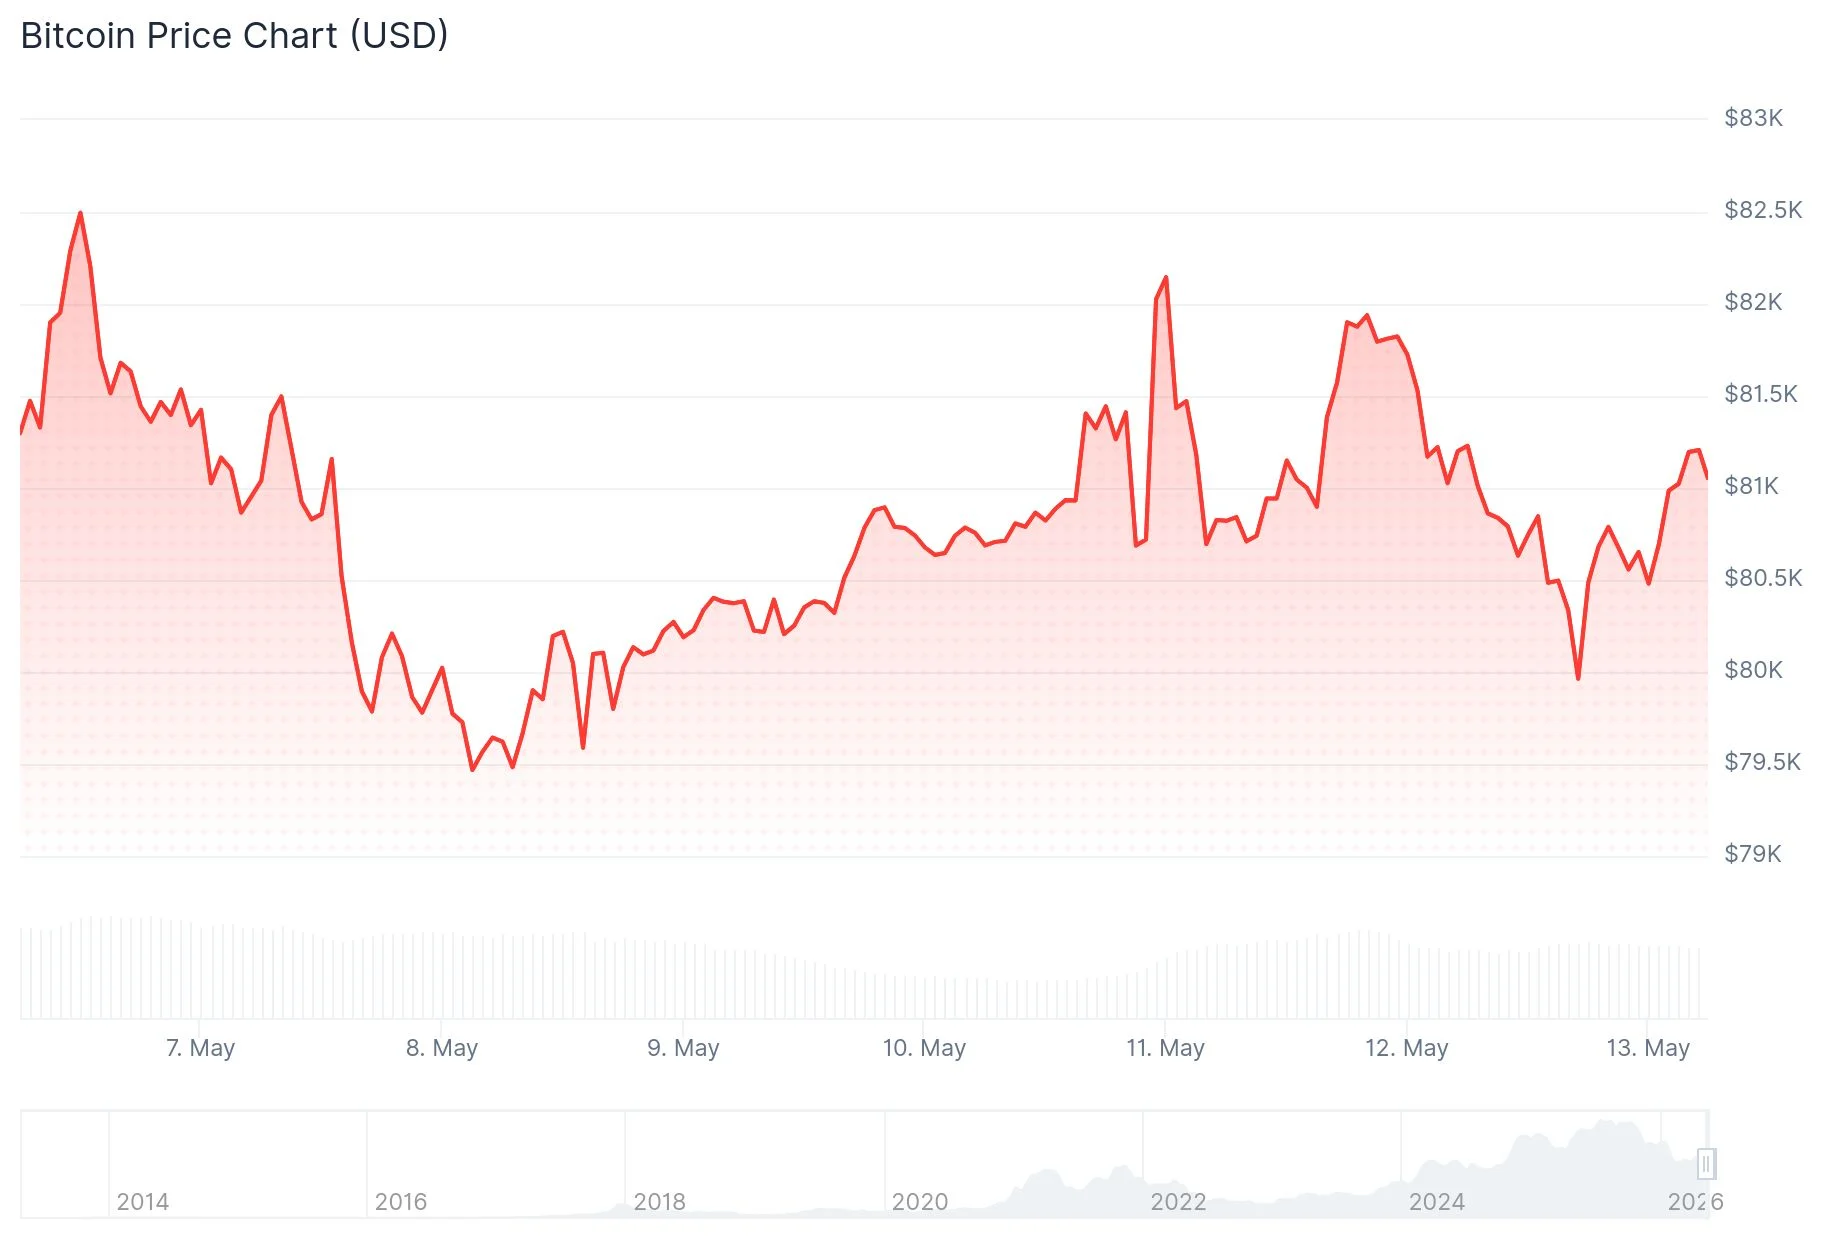
- BTC maintained positions around $80,000 while facing difficulty breaking through the $82,000–$82,600 zone
- The 200-day simple moving average near $82,600 presents a critical obstacle for bullish momentum
- Bitcoin ETFs recorded net outflows while the Coinbase Premium Index remained in negative territory
Bitcoin maintained its position around the $80,000 mark on Tuesday following the release of April’s US Consumer Price Index data, which registered at 3.8% on an annual basis. This figure represents the most elevated inflation reading witnessed since May 2023.
The month-over-month rise came in at 0.6%, aligning with economist predictions. Core inflation metrics, excluding volatile food and energy components, posted a 0.4% monthly gain and 2.8% yearly increase.
Energy sector prices dominated the inflationary pressures. According to Bureau of Labor Statistics data, energy expenses surged 3.8% during April alone, representing over 40% of the aggregate monthly advance. On a year-over-year basis, energy prices have climbed nearly 18%.
The persistent US-Iran military conflict and resulting petroleum supply constraints continue pushing energy expenses upward.
Crypto analyst Daan Crypto Trades noted on X that Bitcoin remains “still fighting the Daily 200MA/EMA and November lows,” characterizing it as “the level to break for the bulls to see further upside into the mid/high $80Ks.”

BTC Trapped Between $80K Floor and $82K Ceiling
Bitcoin changed hands near $80,681 throughout Tuesday’s trading session, touching an intraday bottom around $80,415. Selling pressure consistently emerged whenever price action tested the $82,000 threshold.
Market analysis platform Material Indicators pinpointed the 200-day simple moving average positioned near $82,600 as a formidable resistance barrier. The firm observed that bullish participants seem to be establishing a support foundation at $80,700 for a subsequent challenge of that overhead level.
Cryptocurrency strategist Michaël van de Poppe highlighted the 21-day simple moving average at $78,800 as a crucial technical marker. He emphasized that $76,000 represents a support boundary he hopes remains intact, cautioning that a breakdown beneath that threshold could trigger “substantially lower” price levels.
The Coinbase Bitcoin Premium Index persisted in negative territory during recent trading periods. This metric generally indicates diminished US-based spot market demand relative to international trading venues.
ETF Capital Flight and Fed Policy Ambiguity Intensify Headwinds
Spot Bitcoin exchange-traded funds experienced capital withdrawals in recent days, diminishing near-term purchasing momentum.
Treasury yields advanced following the inflation report, while equity index futures deteriorated as market participants recalibrated interest rate projections. The Federal Reserve’s stated 2% inflation objective remains significantly distant from the current 3.8% measurement.
The CME FedWatch Tool indicates market expectations for policy rates to remain steady throughout 2026 and into the following year. Nevertheless, according to The Kobeissi Letter, the probability of rate increases has been gradually climbing.
Kevin Warsh’s appointment to chair the Federal Reserve advanced past an important Senate procedural vote this week, introducing additional policy ambiguity for financial markets.
Bitcoin’s subsequent directional movement hinges on whether purchasing interest can defend the $80,000 threshold. A daily settlement above $82,000 would alleviate immediate downward pressure.
Get 3 Free Stock Ebooks
Discover top-performing stocks in AI, Crypto, and Technology with expert analysis.
- Top 10 AI Stocks - Leading AI companies
- Top 10 Crypto Stocks - Blockchain leaders
- Top 10 Tech Stocks - Tech giants

