
 Golden Cross Signal Returns: Historic Rally Indicator Emerges Again")
Key Takeaways
- The MVRV ratio golden cross formation is developing, a pattern that historically signaled significant Bitcoin price surges.
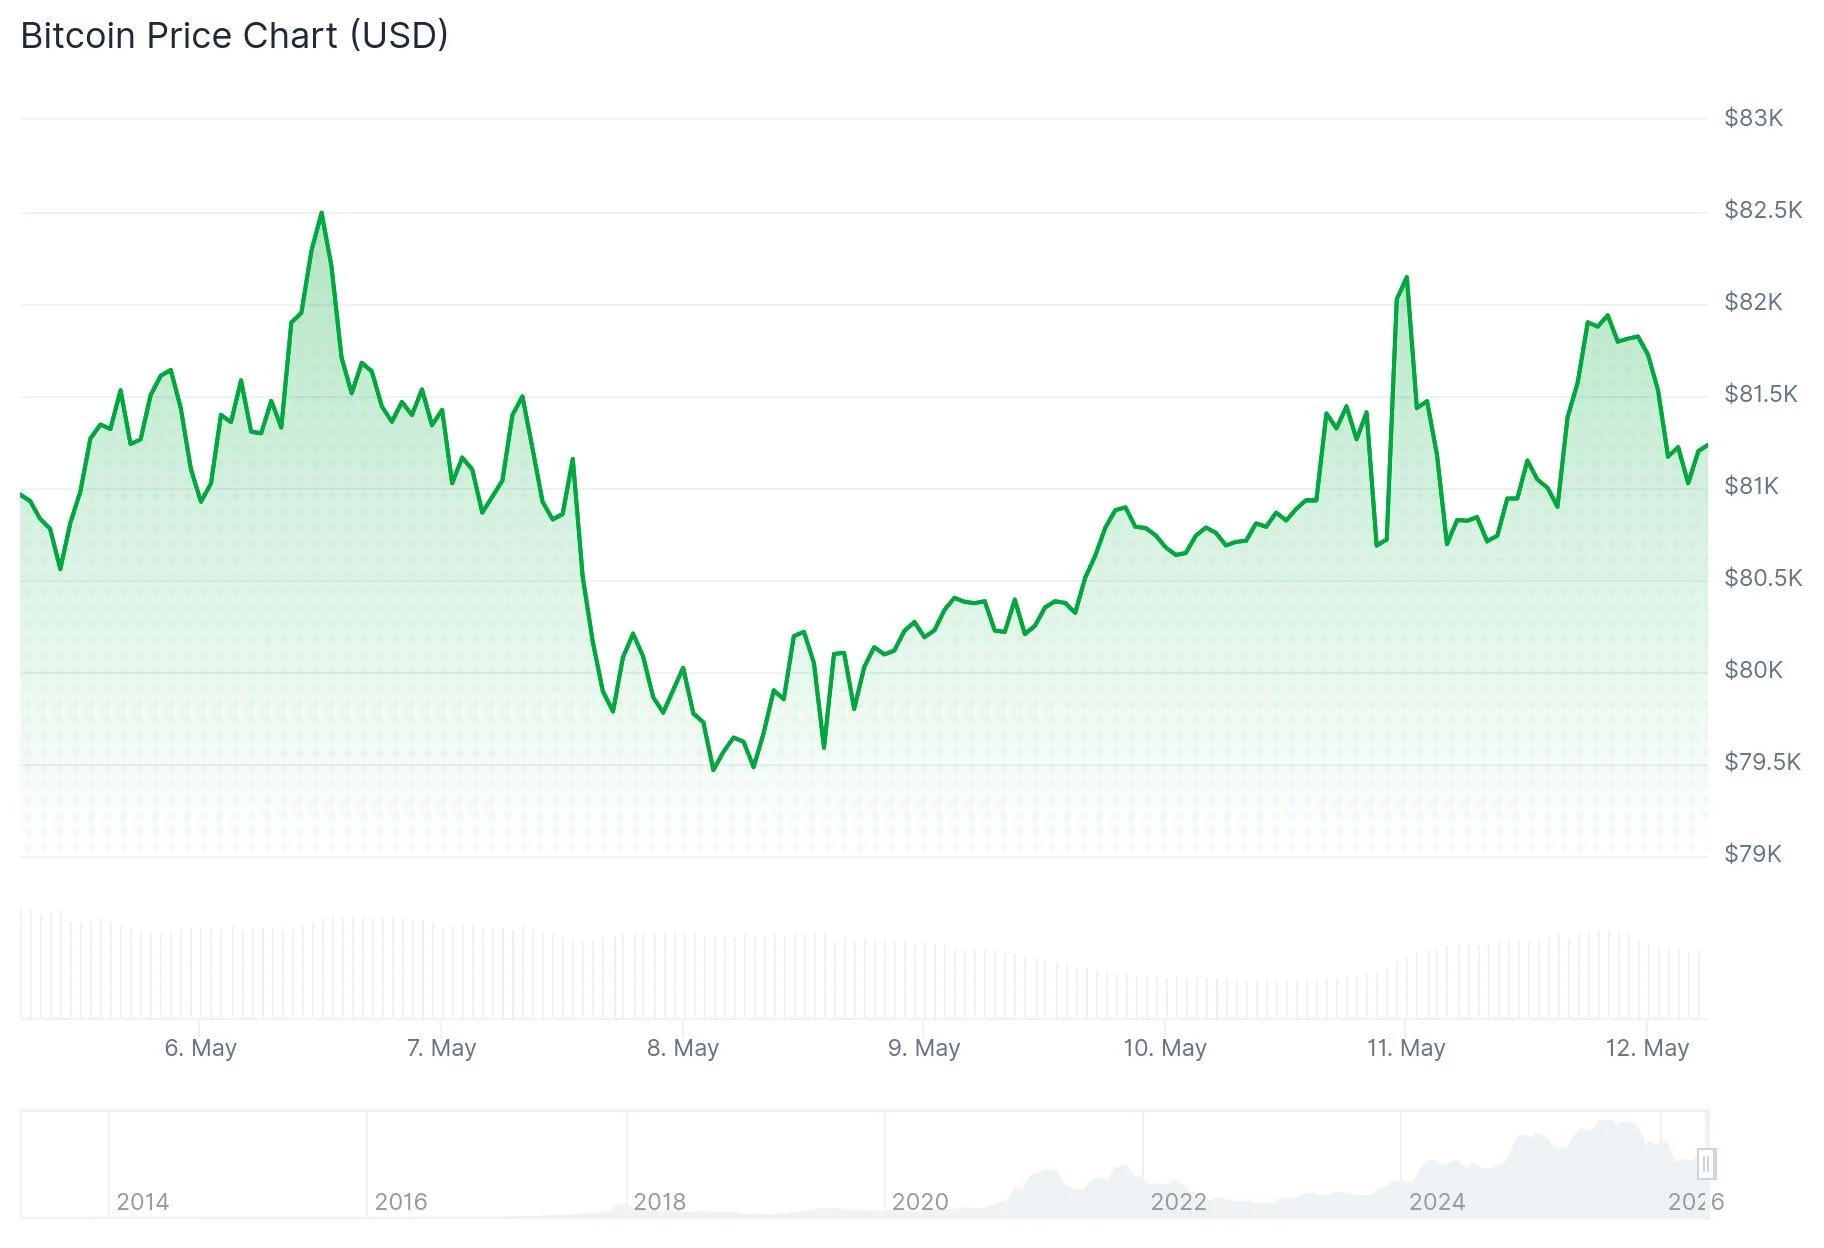
- Bitcoin is holding support between $80,500 and $82,000 while attempting to break through short-term resistance barriers.
- Critical overhead zones include the STH cost basis “heated” level at $92,000 and “overheated” threshold at $104,000.
- Trader Daan Crypto Trades highlighted a strong weekly candle close above the bull market support zone, emphasizing $82K daily 200MA as crucial resistance.
- Institutional interest remains robust with $623 million in net BTC ETF inflows recorded last week, extending the streak to six weeks.
A historically significant pattern known as the MVRV “golden cross” is developing for Bitcoin, even as the cryptocurrency consolidates near the critical $82,000 threshold.
The MVRV (Market Value to Realized Value) ratio serves as a gauge for determining Bitcoin’s valuation relative to historical averages. CryptoQuant analyst CW8900 highlighted that a golden cross formation between the MVRV ratio and its 200-day exponential moving average is developing. The analyst characterized this as “a representative trend reversal signal and is a bullish indicator.”
This technical pattern has materialized only twice previously. Following Bitcoin’s 2022 bear market bottom, the initial crossover signaled the beginning of a 90% price surge from $16,300 to $31,000. The second occurrence in September 2023 preceded an extraordinary 400% advance that culminated in the all-time peak of $126,000 in October 2025.
CW8900 further observed that Bitcoin’s 30-day simple moving average crossed above its 90-day counterpart in late April, declaring: “BTC has completely turned to a bullish trend.”
Technical Analysis and Institutional Capital Flows
Cryptocurrency analyst Daan Crypto Trades shared on X that Bitcoin achieved a “solid weekly close above the bull market support band,” noting that breaking through the daily 200MA/EMA zone around $82K would represent “a signal of strength for further continuation.”

Concurrently, SoSoValue reported last week that Bitcoin ETFs accumulated $623 million in net inflows throughout the week, representing the sixth consecutive week of positive flows. They characterized it as a “week of layered capital allocation” rather than aggressive risk appetite, with some short-term holders taking profits while institutional participants continue building positions.
Analyst Shib Spain observed that Bitcoin breached a multi-month descending trendline on the weekly timeframe, highlighting a MACD bullish crossover as additional confirmation. Analyst Moustache pointed out that the Bitcoin market cap RSI rebounded from multi-year monthly support, declaring: “Prices will go much, much higher.”
Current Price Dynamics and Critical Zones
Bitcoin encountered rejection above $81,500 and experienced a retracement, presently maintaining support above $80,500 and the 100-hour simple moving average. A contracting triangle formation has developed on the hourly timeframe, establishing support near $80,800.
Should Bitcoin overcome $81,800 and $82,000 resistance, subsequent targets include $82,250, $82,500, and $83,500. Conversely, critical support zones are positioned at $80,400, followed by $79,400, and $78,500.
The short-term holder cost basis “heated” zone stands at $92,000, while the “overheated” threshold resides at $104,000. Although some profit realization has occurred, on-chain metrics from Glassnode indicate potential for additional near-term upside movement.
The $623 million in BTC ETF inflows during the previous week represents the sixth straight week of institutional capital accumulation, with long-term allocation strategies remaining intact despite brief outflows toward week’s end.
Get 3 Free Stock Ebooks
Discover top-performing stocks in AI, Crypto, and Technology with expert analysis.
- Top 10 AI Stocks - Leading AI companies
- Top 10 Crypto Stocks - Blockchain leaders
- Top 10 Tech Stocks - Tech giants

