



Key Takeaways
- BTC experienced a 3% decline to approximately $62,000 following heightened U.S.-Iran geopolitical tensions centered on the Strait of Hormuz
- President Trump announced U.S. control of the strait with plans to implement a 20% fee on cargo shipments
- Crude oil prices jumped over 9%, sparking renewed inflation concerns and driving investors away from speculative assets
- Market analysts identified significant short positions and cautioned that the $60,000 level could be tested
- Large wallet addresses holding 10–10K BTC accumulated approximately 11,000 BTC during the previous week, suggesting bullish conviction
Bitcoin experienced a notable downturn on Monday as escalating geopolitical friction between the United States and Iran concerning the Strait of Hormuz drove investors toward safer havens and away from cryptocurrency markets.
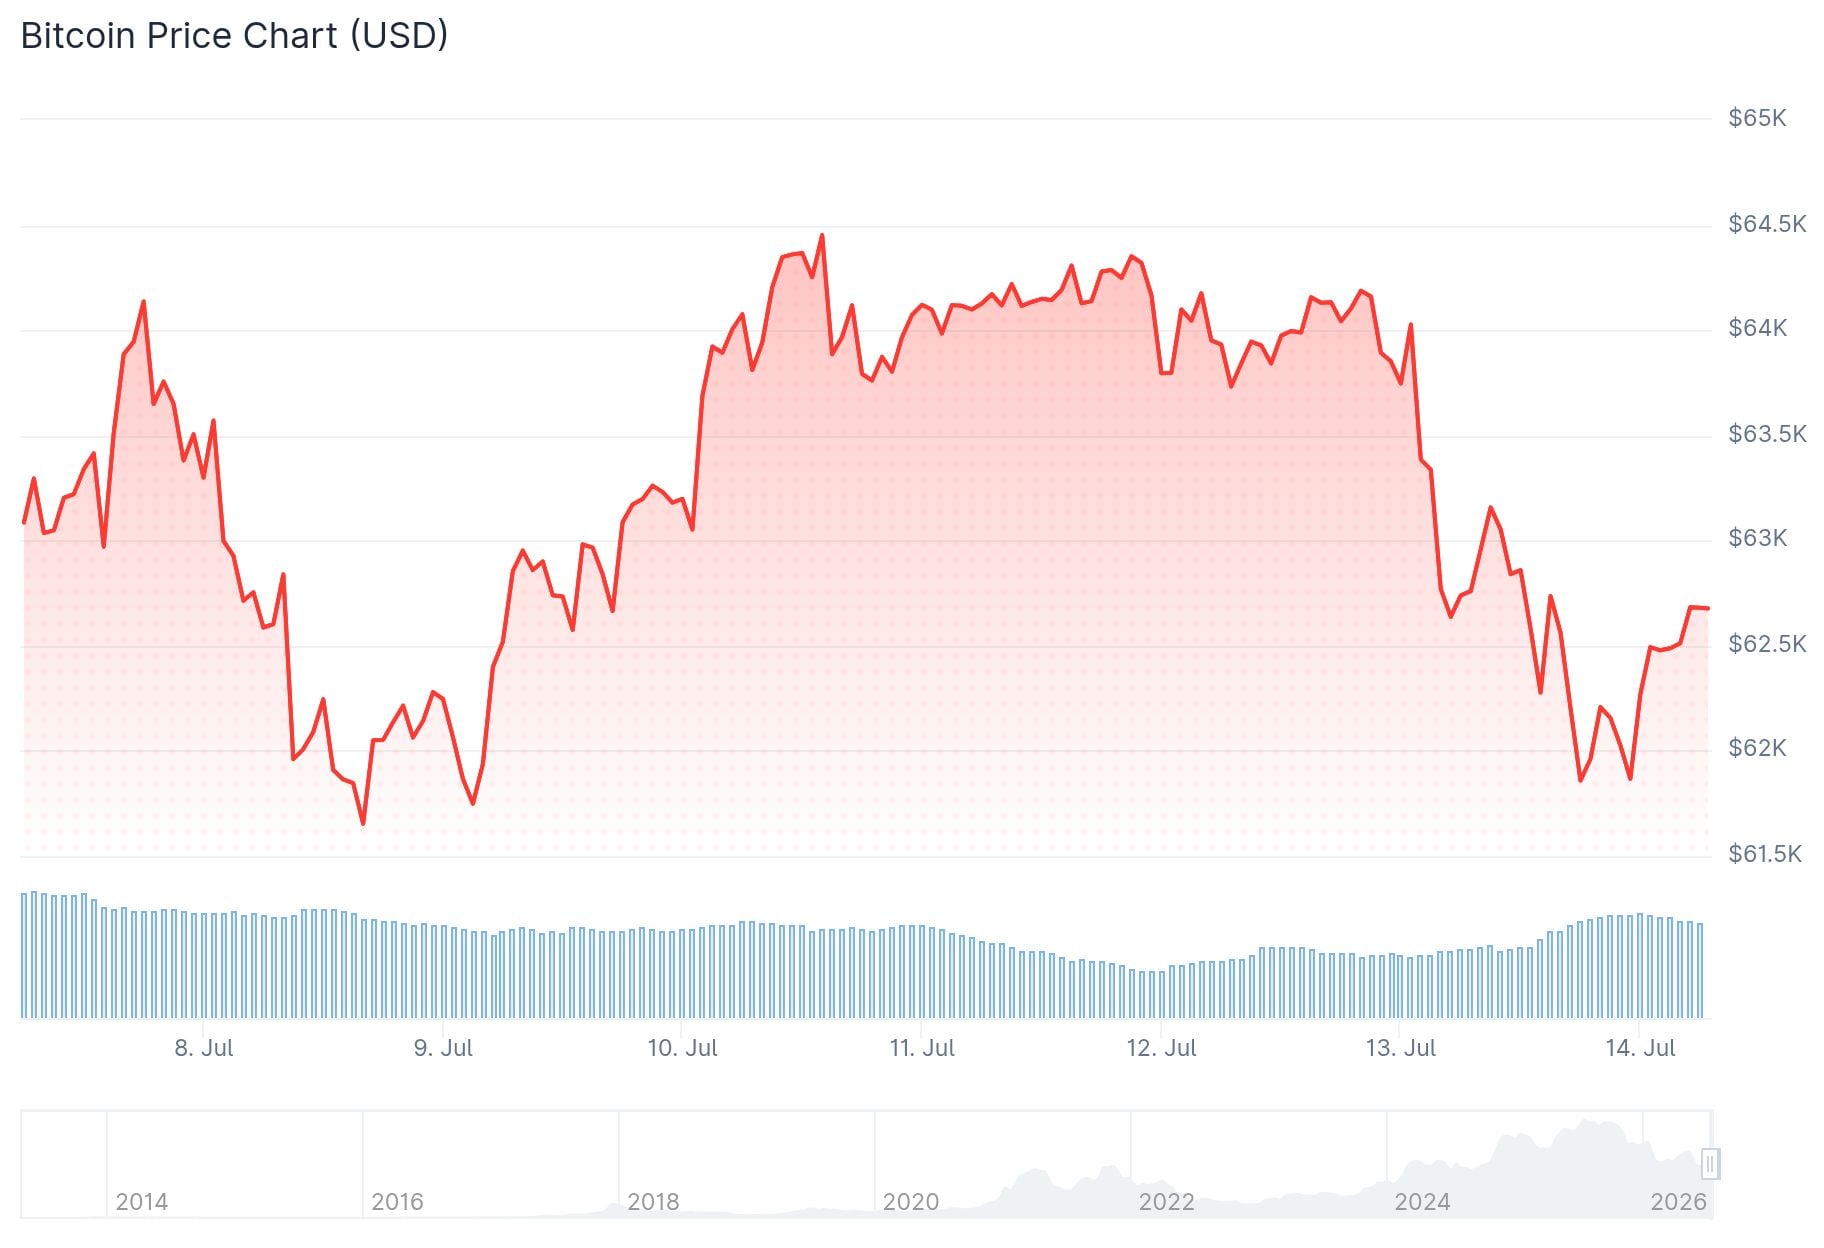
BTC declined 3% to reach $62,009 by Monday evening, continuing its downward trajectory from the weekend. The wider digital asset market mirrored this movement, with leading cryptocurrencies hovering near their yearly lows.
The market downturn followed Iran’s weekend closure of the Strait of Hormuz due to regional instability. The United States launched military strikes in response, with President Trump subsequently declaring American oversight of the strategic waterway.
“The U.S.A. will be known as ‘THE GUARDIAN OF THE HORMUZ STRAIT,'” Trump posted on Truth Social, revealing plans to charge all cargo vessels a 20% transit fee for the protection service.
Crude oil markets reacted sharply, with prices climbing more than 9% on Monday. This spike renewed concerns about inflationary pressures and heightened speculation that the Federal Reserve might pursue additional monetary tightening, diminishing the appeal of high-risk assets like Bitcoin.
Significant Short Pressure Emerges
Market data revealed substantial short-selling activity targeting BTC during the pre-market hours before New York trading commenced. JDK Analysis, a prominent analytics account, highlighted “massive shorting” with the price hovering at a critical volume-weighted average price (mVWAP) threshold.

“With spot also selling, this still looks very weak,” JDK posted on X. “But if New York brings real spot demand and mVWAP holds, a bounce could trap a large number of sellers.”
Market observer Exitpump similarly noted a “crazy amount of aggressive shorting” as open interest metrics continued climbing.
Bitcoin exchange-traded funds have now registered eight consecutive weeks of net capital withdrawals, according to SoSoValue data, indicating diminishing institutional interest.
Crypto Analyst Ash Crypto Identifies Critical Price Zones
Crypto analyst Ash Crypto shared on X that Bitcoin completed its weekly candle formation above the 200-day moving average with a doji pattern, reflecting market indecision. He outlined two potential paths: maintaining support above $58K could propel Bitcoin toward $67K and eventually $83K. Conversely, losing $58K on a weekly closing basis would expose the next support level near $49K. He emphasized that this week’s U.S. Consumer Price Index release could serve as a decisive catalyst.
Blockchain analytics from Santiment revealed that wallet addresses containing between 10 and 10,000 BTC accumulated roughly 11,000 BTC throughout the past week. Santiment emphasized that this category of holders has historically demonstrated strong correlation with price movements.
Trader Roman maintained his optimistic outlook, citing RSI indicators and volume patterns that suggest downside exhaustion. His price target remains in the $70,000–$75,000 range.
BTC was trading near $62,815 according to the most recent market data.
Get 3 Free Stock Ebooks
Discover top-performing stocks in AI, Crypto, and Technology with expert analysis.
- Top 10 AI Stocks - Leading AI companies
- Top 10 Crypto Stocks - Blockchain leaders
- Top 10 Tech Stocks - Tech giants


