



Key Takeaways
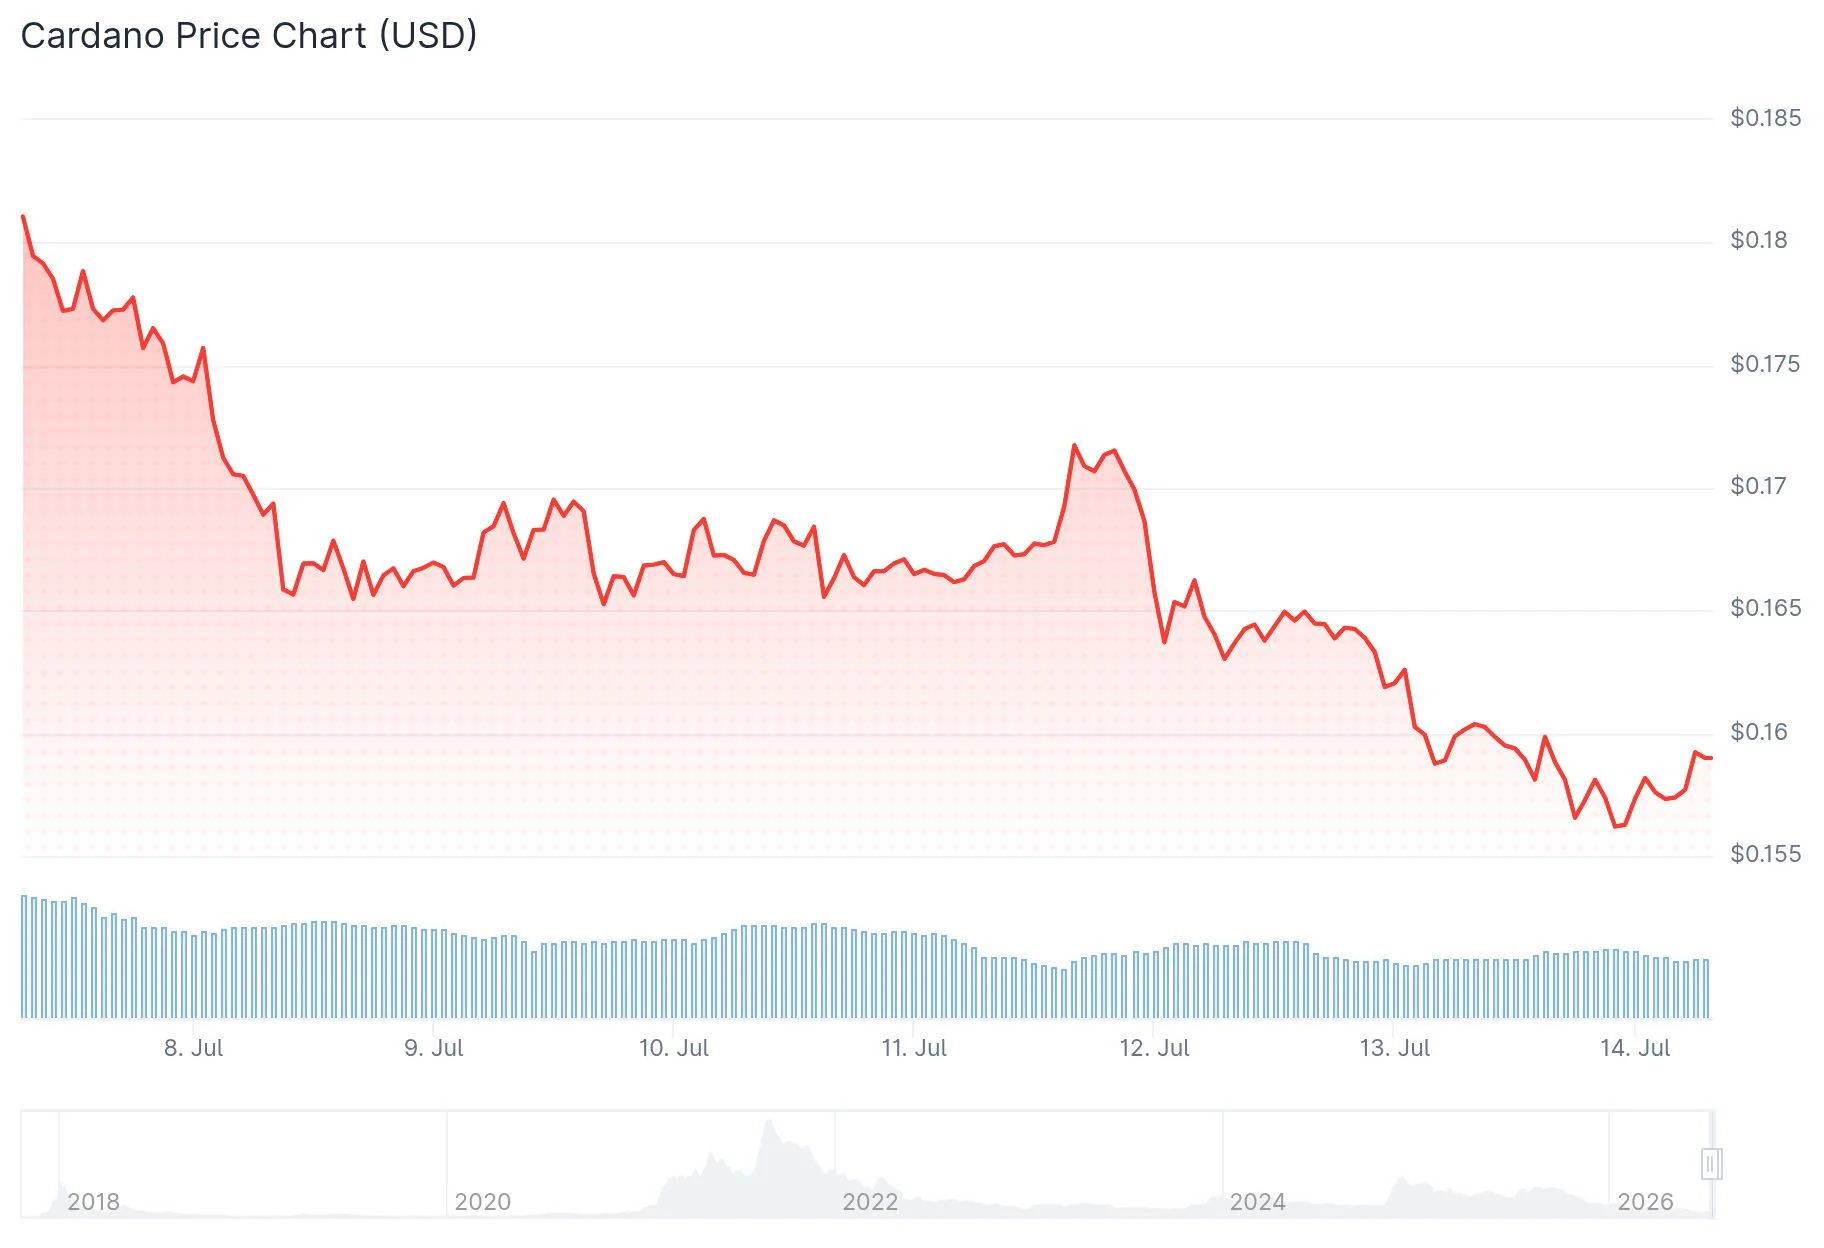
- Cardano is currently trading around $0.158, registering a 14%+ weekly decline
- Large holders managing 100K–100M ADA have added 320 million tokens since early July
- Major stakeholder balances have reached their highest point since February 2023
- Futures market indicators reflect bearish positioning with negative funding and weak long interest
- A sustained move above $0.18–$0.20 is needed to shift momentum back to bulls
Cardano (ADA) is hovering around $0.158 on Monday, continuing its downward trajectory after shedding more than 14% over the past seven days. The digital asset remains beneath all significant moving averages, with near-term momentum showing limited strength.
While the price action appears discouraging, a different story is unfolding among large-scale investors. According to analytics from Santiment, addresses controlling between 100,000 and 100 million ADA have been on a buying spree, adding 320 million tokens to their portfolios since July 7. The aggregate holdings of major stakeholders now exceed 25.6 billion ADA — marking the highest concentration since February 2023.
Smaller investors, however, are heading for the exits. Wallets containing less than 100 ADA have reduced their positions by approximately 0.7% during the last four months.
Santiment’s team addressed this divergence explicitly: “Strong hands are adding while the chart still looks uncomfortable.” Their analysis emphasized that whale and shark-tier wallets are absorbing available supply as retail participants exit positions, characterizing it as one of the most constructive accumulation patterns ADA has displayed throughout the year. The firm also referenced ongoing development milestones including Leios testnet implementation, Hydra scaling enhancements, and Mithril advancements.
Futures Market Reflects Pessimistic Sentiment
Open Interest in ADA futures contracts has declined to $385 million, marking a sustained downtrend. The OI-Weighted Funding Rate turned negative on Friday and currently stands at -0.0028% on Monday, indicating that short position holders are compensating long holders — a classic indicator of bearish market structure.

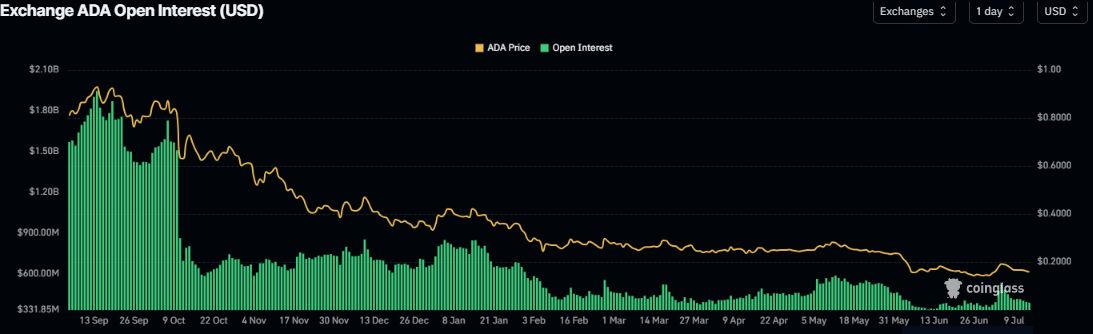
The long-to-short ratio has dropped to 0.79, approaching its lowest reading in more than 30 days. Any figure below 1.0 signals that more market participants are positioned for downside movement than upside.
Technical indicators paint a similar picture. The Relative Strength Index is lingering near 42, while the MACD histogram continues fading toward the neutral line. Overhead resistance layers are stacked at the 50-day EMA ($0.181), 100-day EMA (approximately $0.211), and 200-day EMA ($0.280).
Critical Price Zones Under Observation
Cardano is currently stabilizing around the $0.16 level, which market participants are viewing as immediate support. Should this zone hold firm, initial bounce targets include $0.17 and $0.18. Breaking decisively above $0.20 would represent a more substantial confirmation that demand is regaining control.
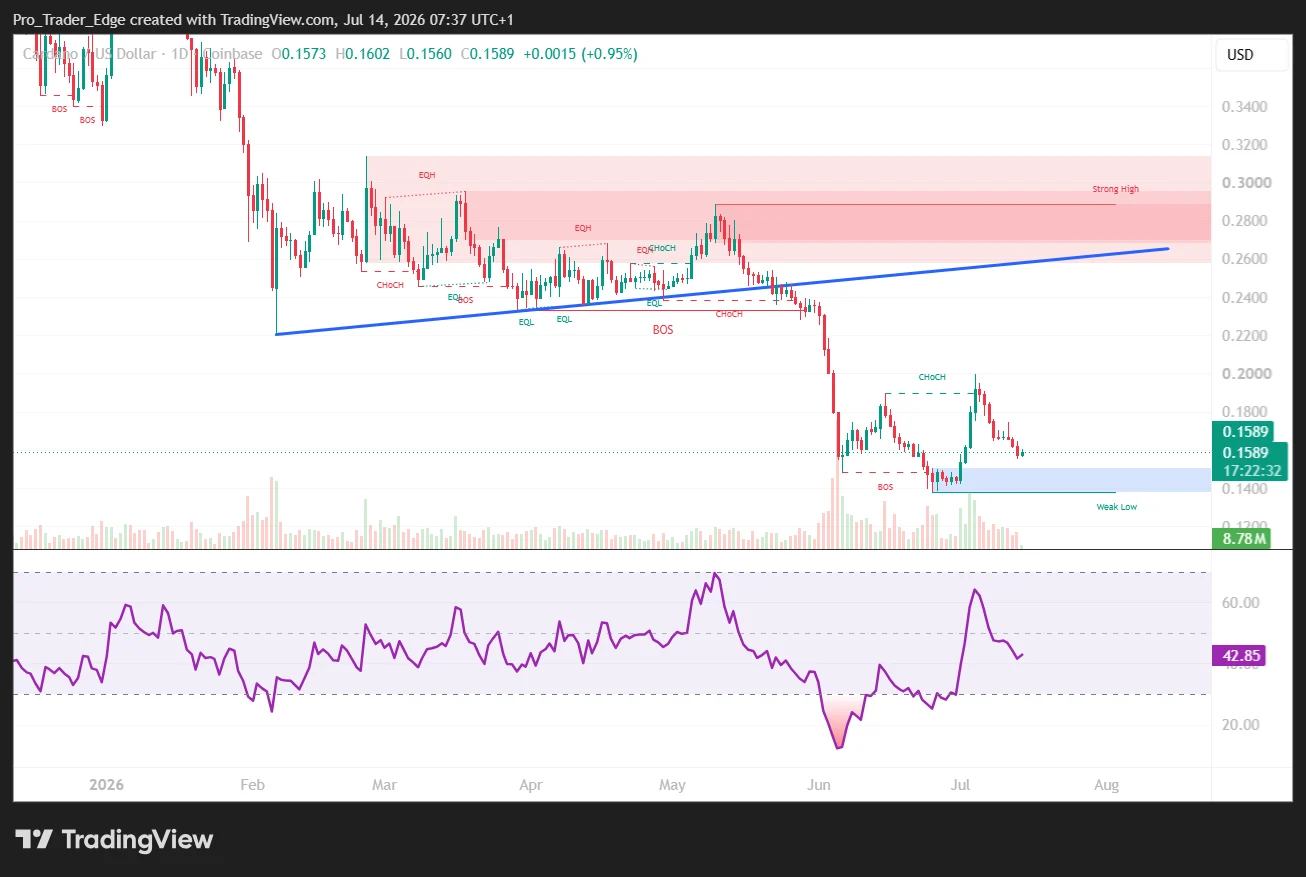
Looking at downside risk, $0.150 represents the next critical support threshold. A breakdown below that level would bring the $0.13–$0.14 range into view as a potential deeper accumulation zone.
Several technical analysts interpret ADA’s current movement as a correction within a descending channel pattern that could serve as a consolidation phase before another upward attempt. Successfully breaking above this channel structure would reintroduce $0.18 as the initial target, followed by $0.20.
The $6.8 billion market capitalization threshold is also drawing attention. Recapturing and maintaining that level is considered a pivotal catalyst for broader market recovery.
As of July 14, 2026, Cardano’s key stakeholder holdings remain at their highest concentration in 3.5 years.
Get 3 Free Stock Ebooks
Discover top-performing stocks in AI, Crypto, and Technology with expert analysis.
- Top 10 AI Stocks - Leading AI companies
- Top 10 Crypto Stocks - Blockchain leaders
- Top 10 Tech Stocks - Tech giants


