
 Price: Could This Accumulation Phase Trigger a Major Breakout?")
Key Takeaways
- DOGE currently trades within a third potential accumulation period, mirroring earlier phases that generated gains of 190% and 480%
- Technical analyst Javon Marks identifies a bullish MACD divergence pattern with an initial price objective of $0.6533
- Price action remains supported above the 100-day EMA positioned at $0.1064, while the 200-day EMA at $0.1248 presents immediate overhead resistance
- Recent short position liquidations totaling $17 million over four hours indicate bearish traders are exiting, potentially fueling upward momentum
- Futures market Open Interest stands at $1.64 billion with a positive 0.0057% funding rate, reflecting ongoing buyer participation
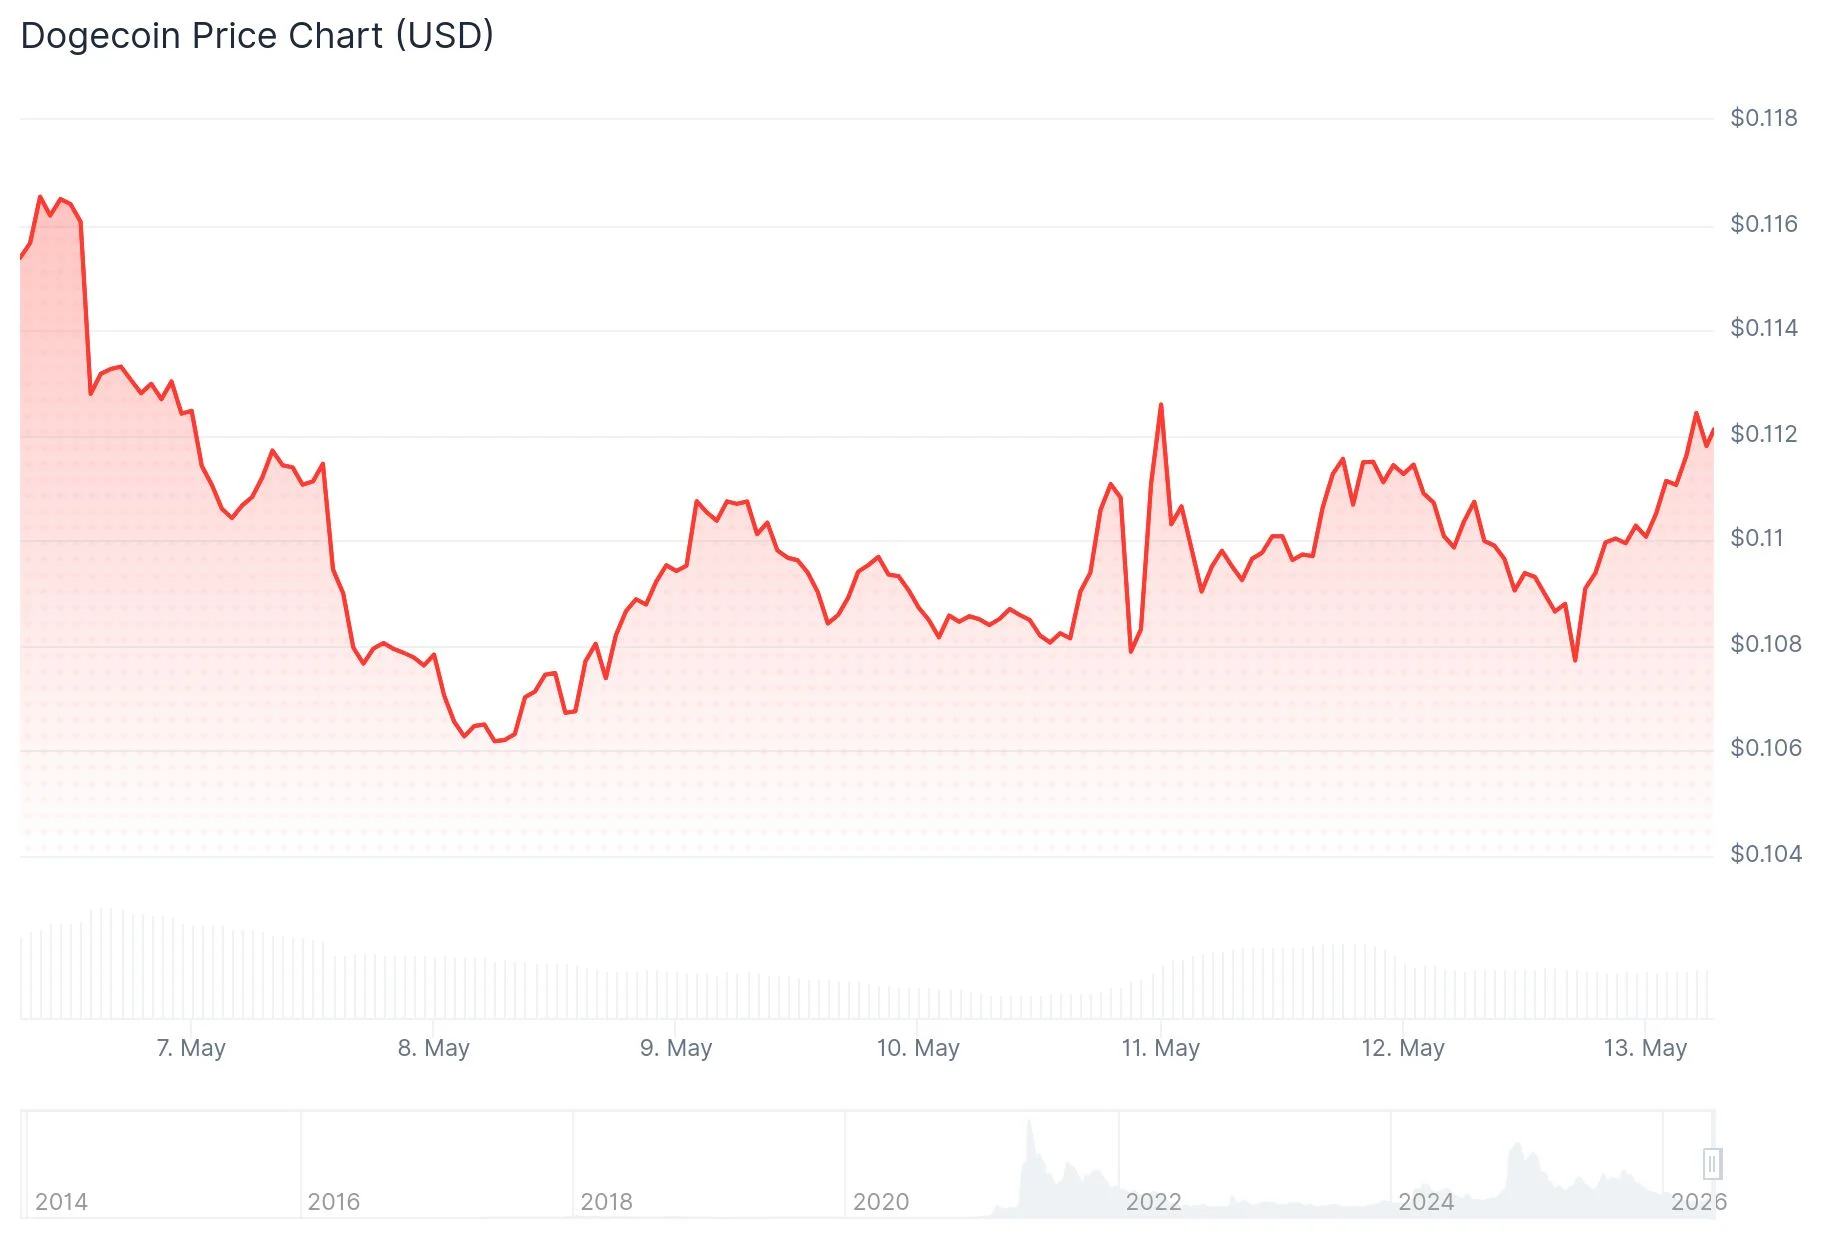
Dogecoin appears to be establishing foundations for a potential upward move after maintaining crucial moving average support levels and displaying encouraging derivatives market signals. On Wednesday, DOGE maintains its position above the 100-day Exponential Moving Average (EMA) at $0.1064, bouncing back following a two-day decline.
Technical analyst Javon Marks recently highlighted a chart demonstrating DOGE’s breakout from an extended descending trendline that originated at the 2021 cycle peak. Marks points out that DOGE has begun reacting to a significant bullish divergence pattern on the MACD indicator. This divergence occurs when an asset’s price establishes lower lows while momentum indicators show strengthening conditions — a configuration frequently monitored by traders anticipating potential trend changes.
The analyst’s initial upside objective sits at $0.6533, a price level that would return DOGE to valuations not observed since the 2021 bull market. Marks additionally suggested that surpassing $0.6533 could potentially unlock movement toward $1.25, although DOGE must first demonstrate sustained strength beyond immediate resistance zones.
Third Accumulation Pattern Emerges
Another technical chart from analyst Bitcoinsensus positions DOGE within what they term “Accumulation 3?” — a horizontal consolidation pattern bearing resemblance to two previous accumulation stages in DOGE’s trading history. The initial accumulation window preceded a substantial 190% price increase, while the second phase preceded an impressive 480% surge.
Bitcoinsensus monitors whether DOGE can successfully breach a descending resistance line that’s been capping price since the late 2024 peak. The Relative Strength Index has begun trending upward from oversold territory, with the RSI crossing above its signal line — representing preliminary momentum improvement, though analysts emphasize the need for sustained confirmation.

Derivatives Data Suggests Bearish Capitulation
Blockchain and derivatives market metrics support the cautiously optimistic technical outlook. According to CoinGlass tracking data, short position liquidations accounted for $17 million of the $21 million total liquidations recorded over the past four hours. This concentration of short liquidations typically coincides with near-term price recoveries following extended selling pressure.

DOGE futures Open Interest has experienced a modest recovery, currently measuring $1.64 billion. The funding rate registers at a positive 0.0057%, indicating long position holders are compensating short holders — a characteristic signal of bullish positioning within derivatives markets.
Examining the technical structure, immediate resistance zones include the $0.1161 supply area and the 200-day EMA positioned at $0.1248. Achieving a daily candle close above $0.1248 would be essential for advancing toward the $0.1500 threshold. Downside support is established at the 100-day EMA ($0.1064) and the 50-day EMA ($0.1024).
The RSI indicator currently reads around 62, positioned above the neutral 50 level, while the MACD has dipped slightly below the zero line, indicating momentum remains somewhat uncertain following the recent price advance.
Get 3 Free Stock Ebooks
Discover top-performing stocks in AI, Crypto, and Technology with expert analysis.
- Top 10 AI Stocks - Leading AI companies
- Top 10 Crypto Stocks - Blockchain leaders
- Top 10 Tech Stocks - Tech giants

