
 Faces Mounting Pressure as Large Holders Reduce Positions")
Key Takeaways
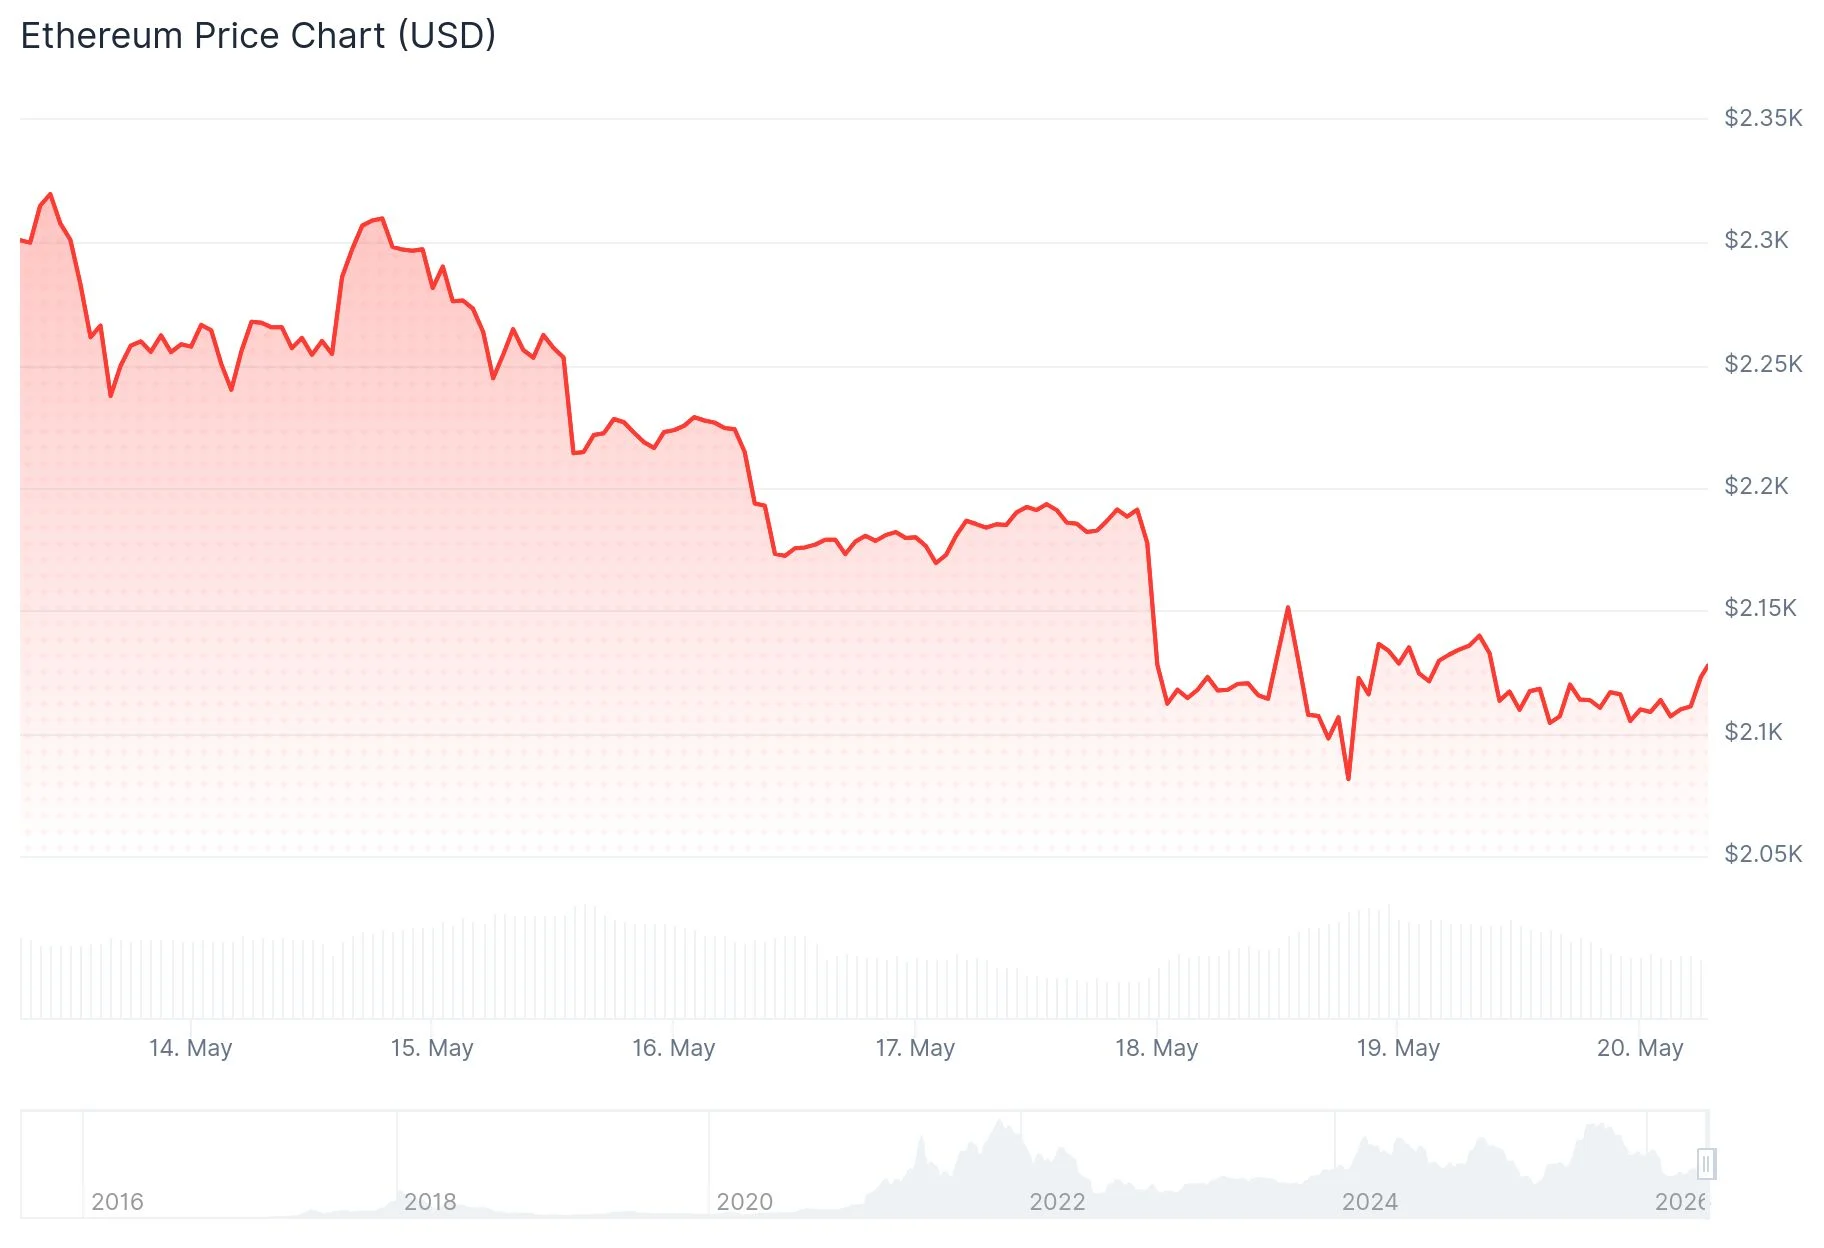
- Ethereum has declined more than 10% over the past seven days, reaching approximately $2,110—a steeper loss than most leading cryptocurrencies.
- Surging US Treasury yields combined with fresh inflation concerns sparked widespread crypto market selloffs, with the 30-year US Treasury yield reaching 5.19%, a level unseen since 2007.
- Over $700 million worth of long positions on ETH were wiped out in liquidations throughout the past week.
- Medium-sized wallet holders offloaded roughly 386,000 ETH between May 11 and May 18, while accumulation activity from whale addresses has also started to decline.
- Technical analyst Crypto Patel projects a potential move down to $1,500 following ETH’s breakdown below a critical trendline positioned at $2,170.
Ethereum is currently hovering near $2,110, showing modest signs of stabilization after enduring a brutal week of sustained selling. The asset posted a modest gain of around 0.5% on Tuesday, yet the overall trend structure continues to look fragile.
This downturn wasn’t unique to Ethereum. A dramatic surge in US Treasury yields drained liquidity from risk-on assets throughout traditional and digital markets. The 30-year Treasury yield spiked to 5.19%, marking the highest reading since 2007. Meanwhile, Japan’s 10-year government bond yield reached an all-time high of 2.81%. Elevated yields typically encourage capital rotation into safer, yield-bearing instruments, creating headwinds for volatile assets like cryptocurrencies.
Despite the broad market weakness, Ethereum suffered disproportionately. Data compiled by Coinglass reveals that ETH saw over $700 million in long position liquidations during the past week alone, surpassing even Bitcoin’s liquidation figures during the same window. Derivatives market indicators had been flashing warning signs of an overleveraged long position buildup prior to the collapse.
Onchain Signals Show Persistent Selling from Key Holders
Blockchain analytics from CryptoQuant reveal that wallets containing between 100 and 10,000 ETH collectively disposed of 386,000 ETH from May 11 through May 18. This distribution behavior has been a recurring theme in recent months.
Initially, whale addresses responded by accumulating approximately 330,000 ETH during the same timeframe, seemingly viewing the decline as a buying opportunity. However, these same large holders subsequently reduced their positions by 60,000 ETH in the days that followed, indicating a potential shift in sentiment or reduced appetite for risk at these price levels.

Market analyst Ali Charts highlighted a troubling development on X: roughly 60 whale addresses holding 10,000 ETH or more have either fully liquidated or consolidated their holdings over the last two months. He emphasized that this pattern coincides with significant exchange inflows and suggested the path forward likely trends “down,” while closely monitoring the critical $2,000 threshold.
Chart Analysis Suggests Further Downside Risk
From a technical standpoint, Ethereum is currently positioned beneath its 20-day, 50-day, and 100-day exponential moving averages, which are clustered in the $2,245 to $2,333 range. The Relative Strength Index hovers around 34, while the Stochastic Oscillator registers approximately 12—both indicators signal persistent bearish momentum with no immediate signs of reversal.
Crypto analyst Crypto Patel observed on social platforms that Ethereum violated a significant ascending trendline at the $2,170 mark, fundamentally altering the market structure to bearish. His analysis projects a downside objective of $1,500, with a bearish invalidation point established at $2,327.
On shorter timeframes, the hourly chart depicts a descending trendline establishing resistance in the vicinity of $2,120. Inability to reclaim the $2,150 level could trigger a move back toward $2,075, with the psychologically significant $2,000 level representing the next major downside target.
Immediate resistance zones are identified at $2,120, followed by $2,150 and $2,200. On the support side, the nearest floors are located at $2,085 and $2,075. A decisive breach below these levels would likely open the door to testing the $2,000 mark.
As of May 20, Ethereum is exchanging hands slightly above $2,108, with both technical chart patterns and blockchain data suggesting a cautious outlook remains warranted in the short term.
Get 3 Free Stock Ebooks
Discover top-performing stocks in AI, Crypto, and Technology with expert analysis.
- Top 10 AI Stocks - Leading AI companies
- Top 10 Crypto Stocks - Blockchain leaders
- Top 10 Tech Stocks - Tech giants

