



Key Takeaways
- ETH declined 2.4% to reach $1,872 following a reversal of post-inflation data momentum beneath $1,900
- Platform holdings increased marginally to 15.13 million ETH, suggesting moderate distribution activity
- Smaller holders liquidated 160K ETH during the previous seven days while larger addresses acquired approximately 100K ETH
- American spot Ethereum ETF products attracted $244.9 million in net capital last week but experienced minor withdrawals recently
- Critical downside protection established at $1,875, with overhead barriers concentrated from $1,920 through $1,955
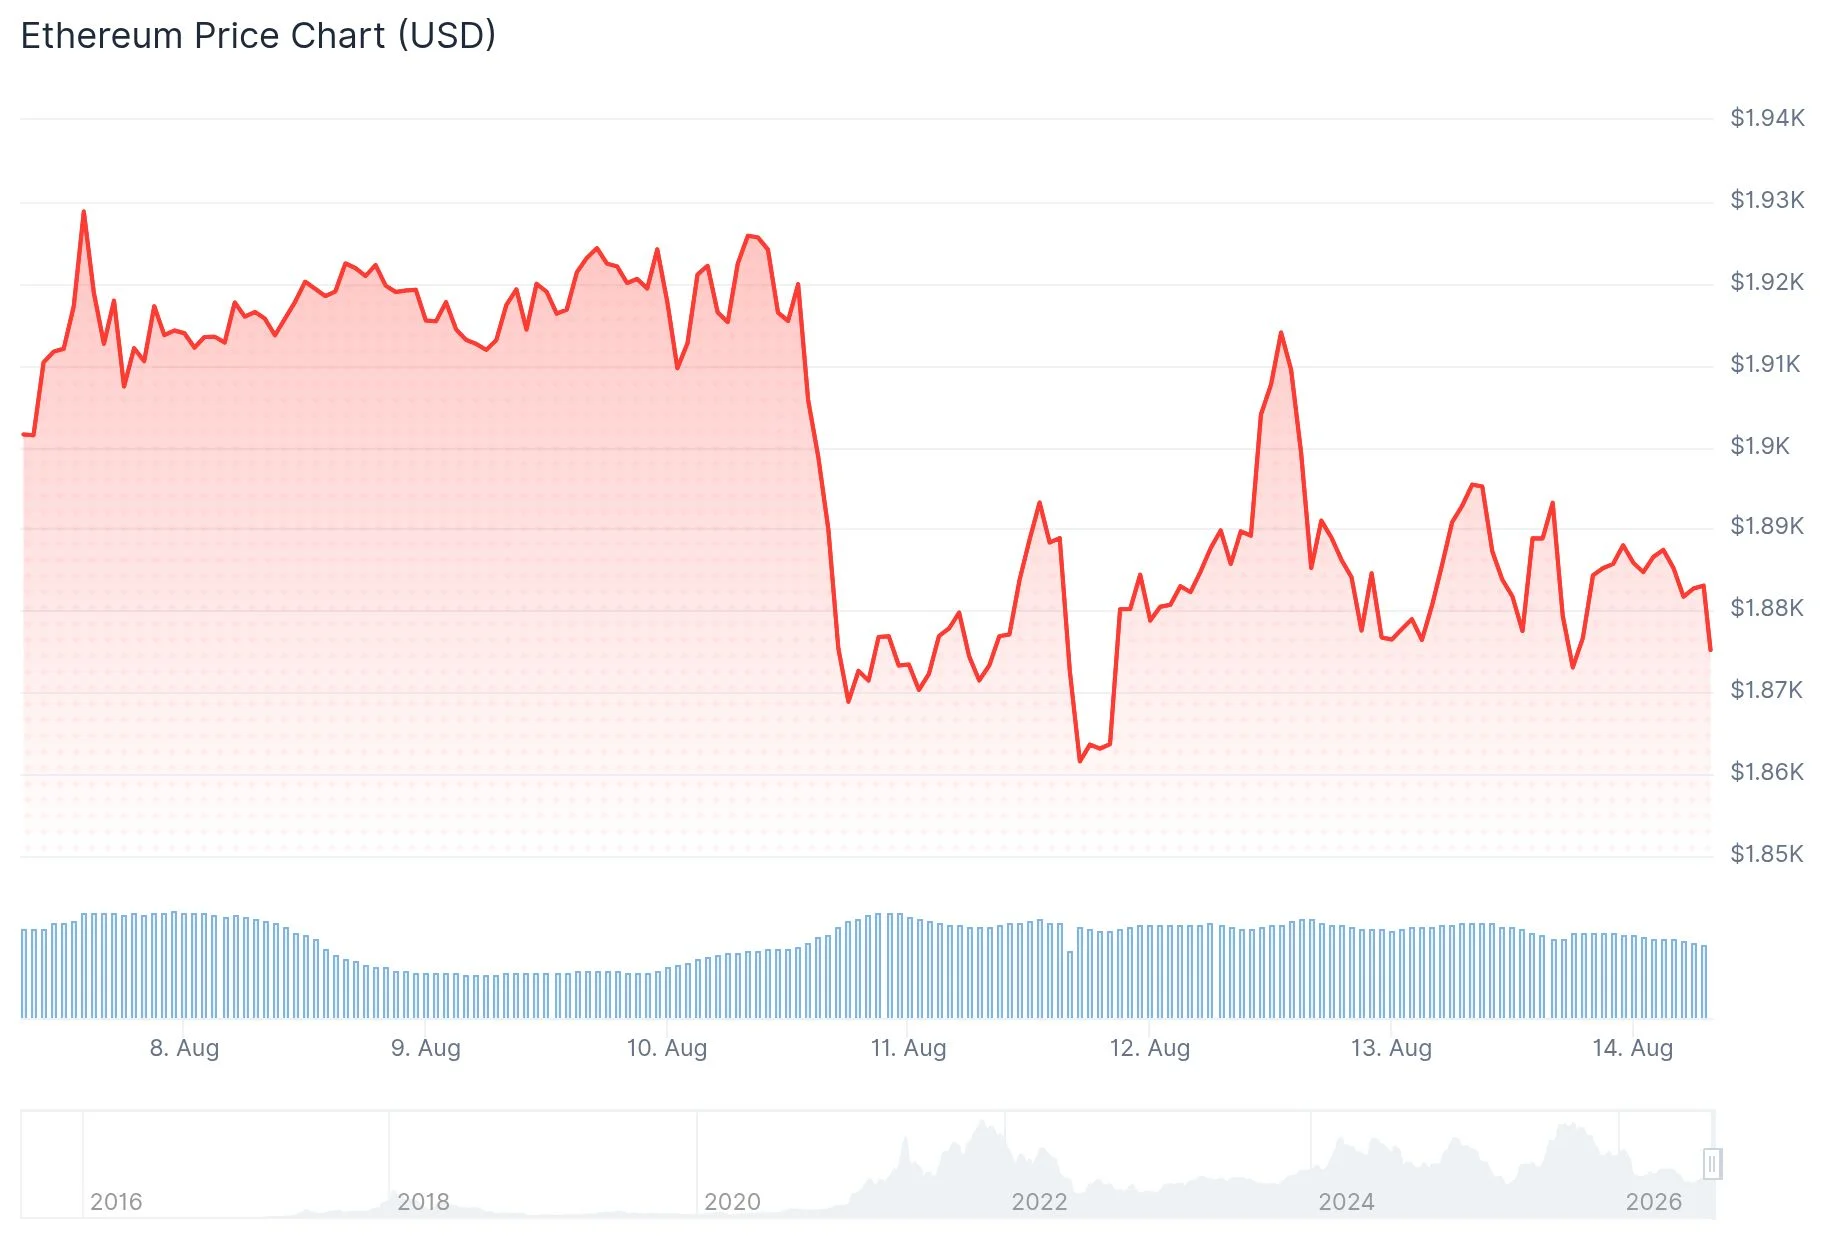
On August 13, Ethereum experienced a 2.4% pullback, sliding from a session peak of $1,918 down to $1,872. This retracement occurred as market participants took profits following the release of United States Consumer Price Index figures, eliminating the cryptocurrency’s earlier session advances.
July’s inflation report revealed headline CPI increasing 0.1% on a monthly basis and 3.4% year-over-year. Core inflation measurements posted a 0.2% monthly gain and 2.5% annual increase. These four metrics aligned precisely with analyst forecasts, providing market participants with no catalyst to extend the rally.
Prior to the economic data release, ETH had appreciated to approximately $1,918 before encountering resistance and subsequent profit-taking. Following the breach of support at $1,887, limited market depth facilitated a swift descent toward the $1,872 threshold.
Bitcoin maintained positioning around $64,000 after the inflation figures, demonstrating that the CPI release failed to materially impact appetite for leading digital assets.
Blockchain Metrics Suggest Bearish Undertones
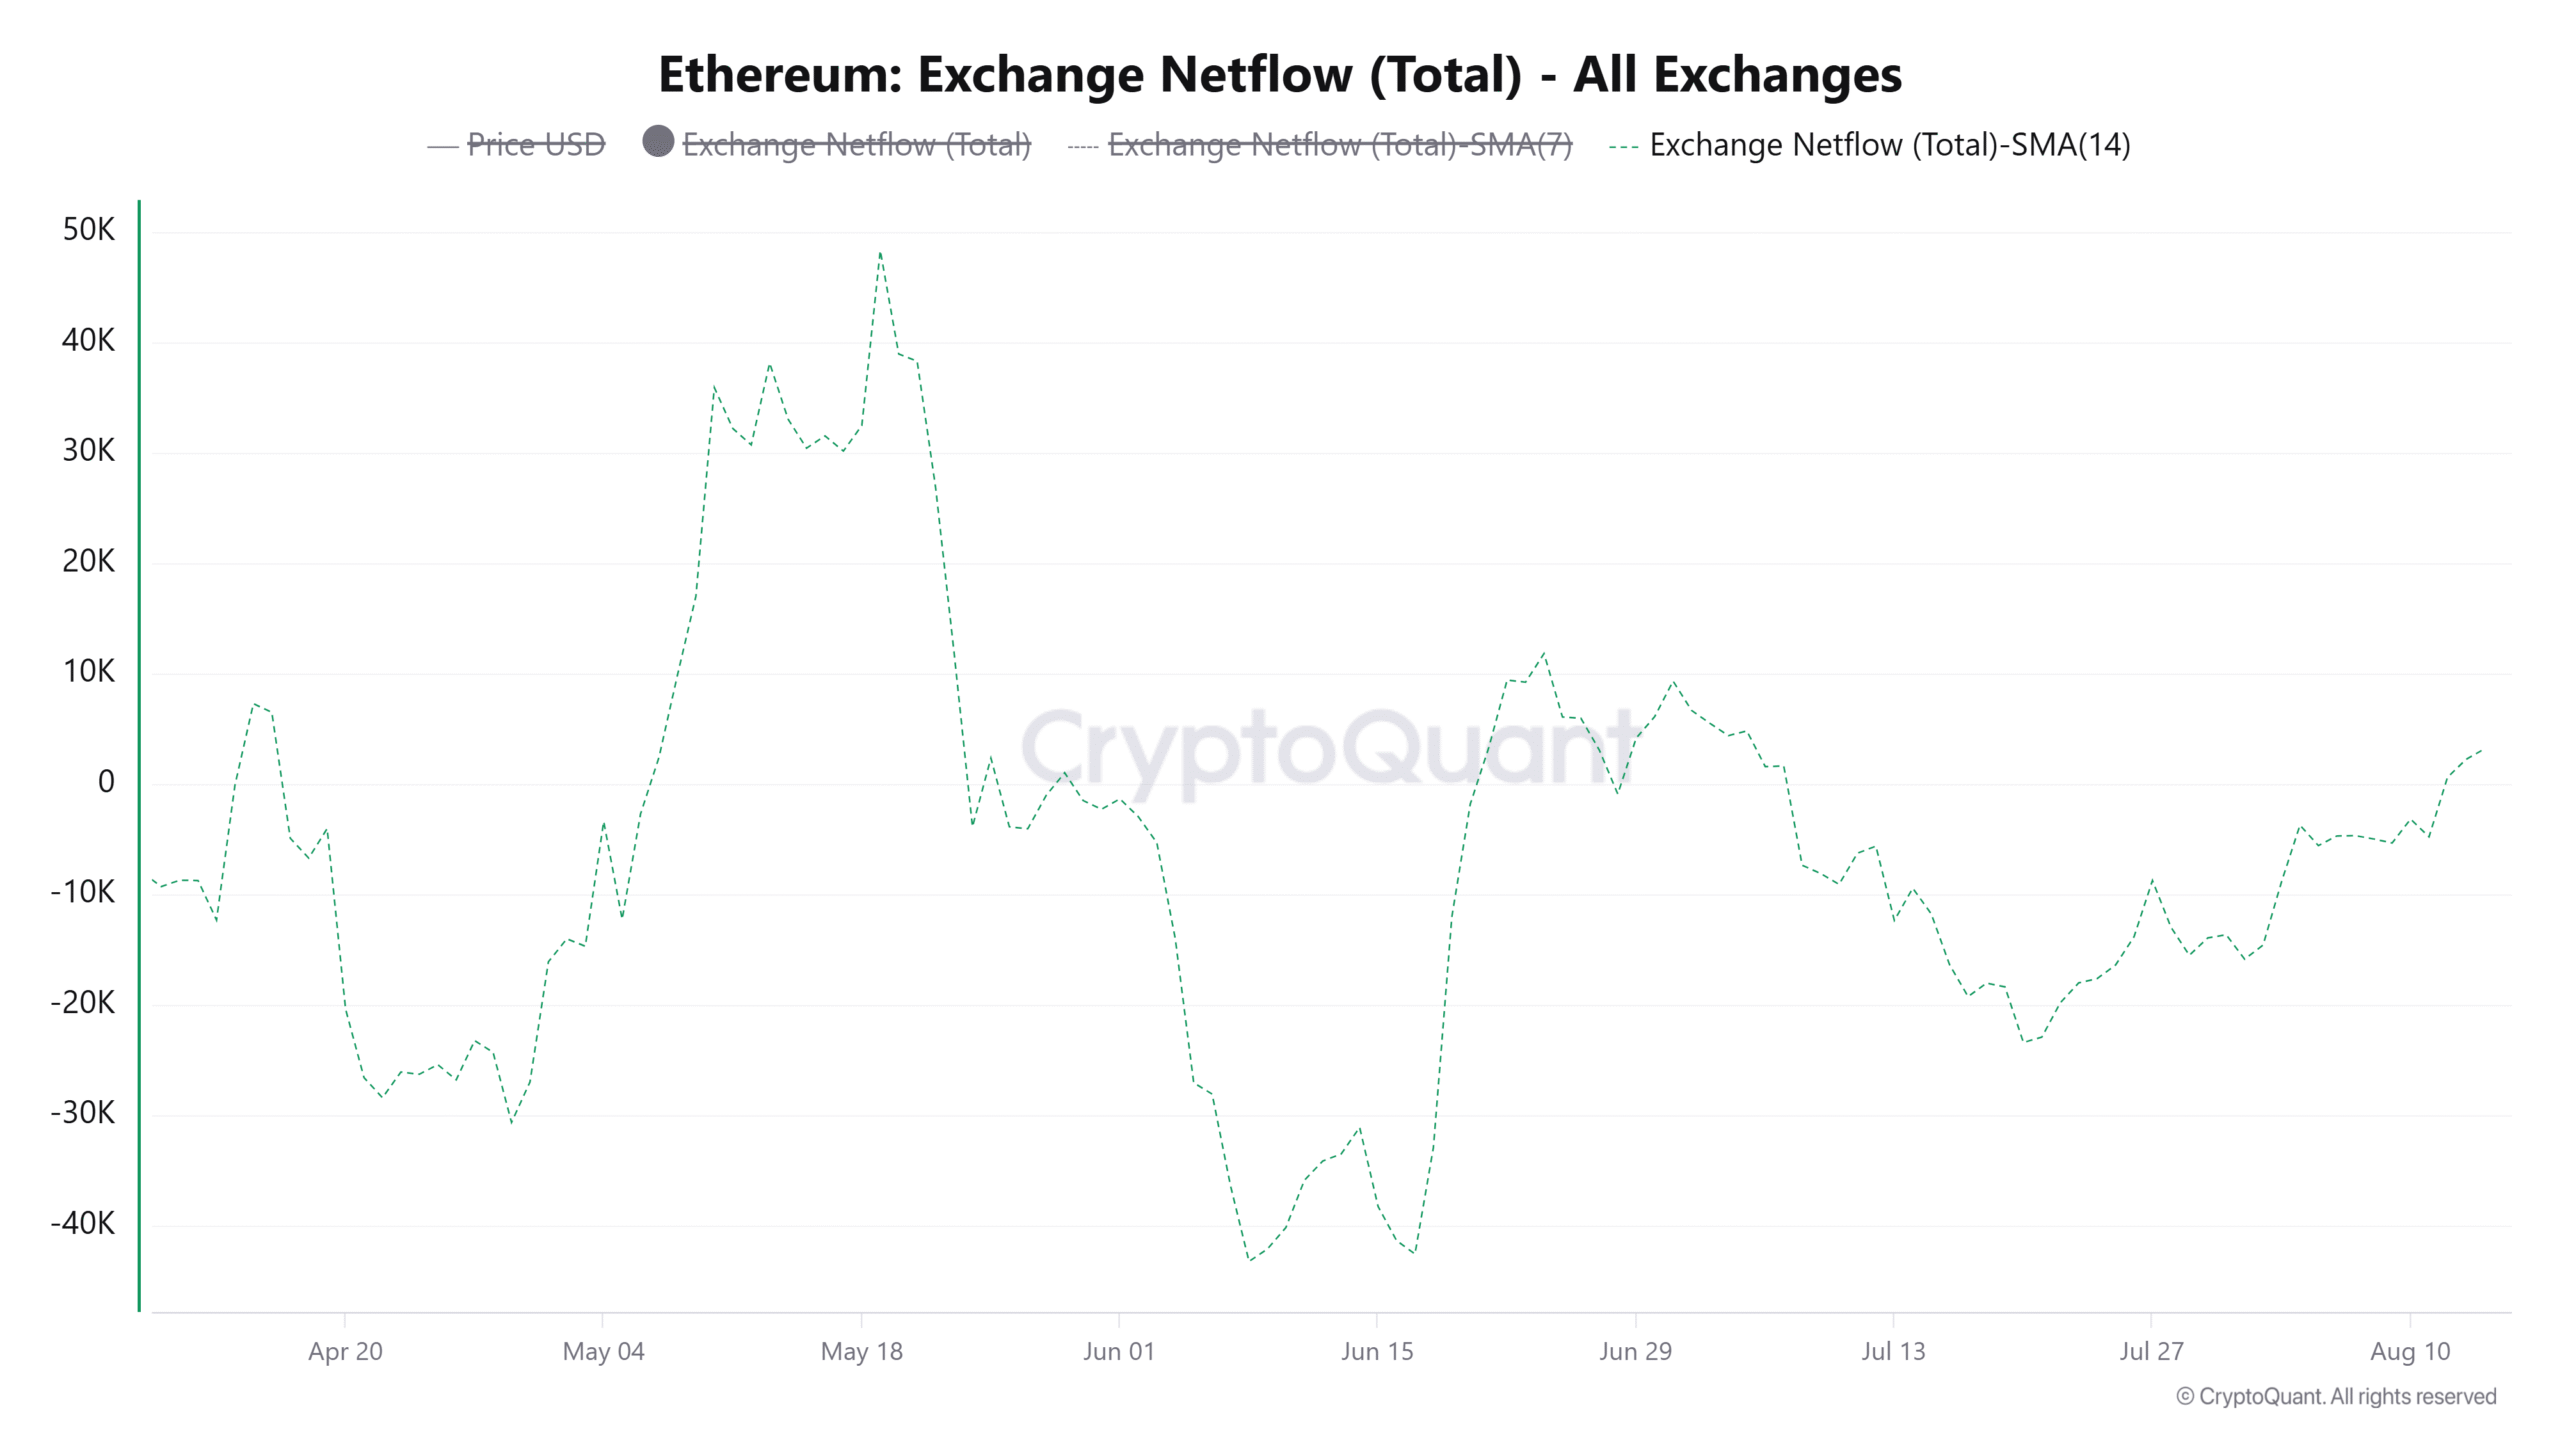
Network analytics revealed concerning conditions preceding the price decline. The 14-day moving average for ETH Exchange Netflow transitioned to positive territory, signaling slight distribution dominance. Platform reserves climbed modestly to 15.13 million ETH, a level that has previously corresponded with heightened distribution activity.

The Coinbase Premium Index declined further to -0.081, despite strength in traditional equity markets. This divergence indicates American cryptocurrency investors maintain a defensive posture.
Addresses containing between 100 and 10,000 ETH distributed a combined 160K tokens throughout the preceding week. Conversely, major holder wallets—those maintaining 10K to 100K ETH—moved in the opposite direction, adding roughly 100K ETH during this same timeframe.
American spot Ethereum exchange-traded funds registered $244.9 million in aggregate inflows during the prior week. Through the current week, these investment vehicles have experienced mild outflows totaling $8.9 million.
Digital asset analyst CryptoGoos observed on X that despite ETH establishing a fresh low, distribution from long-term position holders has diminished while accumulation has strengthened, creating a higher low formation. CryptoGoos characterized this pattern as a bullish divergence signal.
Critical Technical Thresholds Under Observation
The daily timeframe chart positions Ethereum near the $1,875 Murrey Math support zone. Daily Chaikin Money Flow registered -0.04, marginally favoring distribution. The 4-hour Relative Strength Index measured 45.15, positioned below the neutral 50 threshold, indicating subdued momentum characteristics.
CoinGlass liquidation heatmap data reveals substantial clustering between $1,945 and $1,955 above present valuation. Downside concentration zones appear near $1,850 and $1,835.
Market analyst Ted Pillows stated that ETH must recover above $1,920 before any advance toward $2,000 becomes feasible. Technical strategist Daan Crypto Trades concentrated on the ETH/BTC trading pair, highlighting 0.03 BTC as the pivotal level necessary to validate relative outperformance versus Bitcoin.
CryptoQuant researcher MorenoDV observed that ETH’s Net Unrealized Profit/Loss metric on Binance is nearing the -0.35 threshold, a measurement that has historically coincided with significant market bottoms during late 2019, March 2020, and throughout 2022’s lows.
ETH was trading around $1,879 during publication, maintaining position above the 20-day exponential moving average at $1,884 and the 50-day exponential moving average at $1,865.
Get 3 Free Stock Ebooks
Discover top-performing stocks in AI, Crypto, and Technology with expert analysis.
- Top 10 AI Stocks - Leading AI companies
- Top 10 Crypto Stocks - Blockchain leaders
- Top 10 Tech Stocks - Tech giants


