
 Price Poised for 30% Surge After Three-Month Consolidation Phase")
Key Takeaways
- SOL maintains stability around $85, defending the crucial $80–$85 support level following an extended period of downward pressure.
- Technical analysts have identified $100, $125, and $135–$145 as key upside objectives should resistance levels break.
- The token has consolidated within a narrow 10% corridor for ninety days, with expert Daan Crypto Trades forecasting a 20–30% price swing upon breakout.
- Santiment blockchain metrics reveal weekly active addresses declining from 5.01M to 2.89M, while social sentiment reaches January peak levels.
- Critical resistance zone located at $90–$92; a successful breach could trigger upward momentum, whereas losing $80 would confirm bearish continuation.
Solana currently hovers around the $85 mark following an extended sideways consolidation period that began after significant declines from November and January peaks. The cryptocurrency has been confined to a narrow trading corridor, with demand supporting prices at the $80–$85 level while supply prevents meaningful rallies.
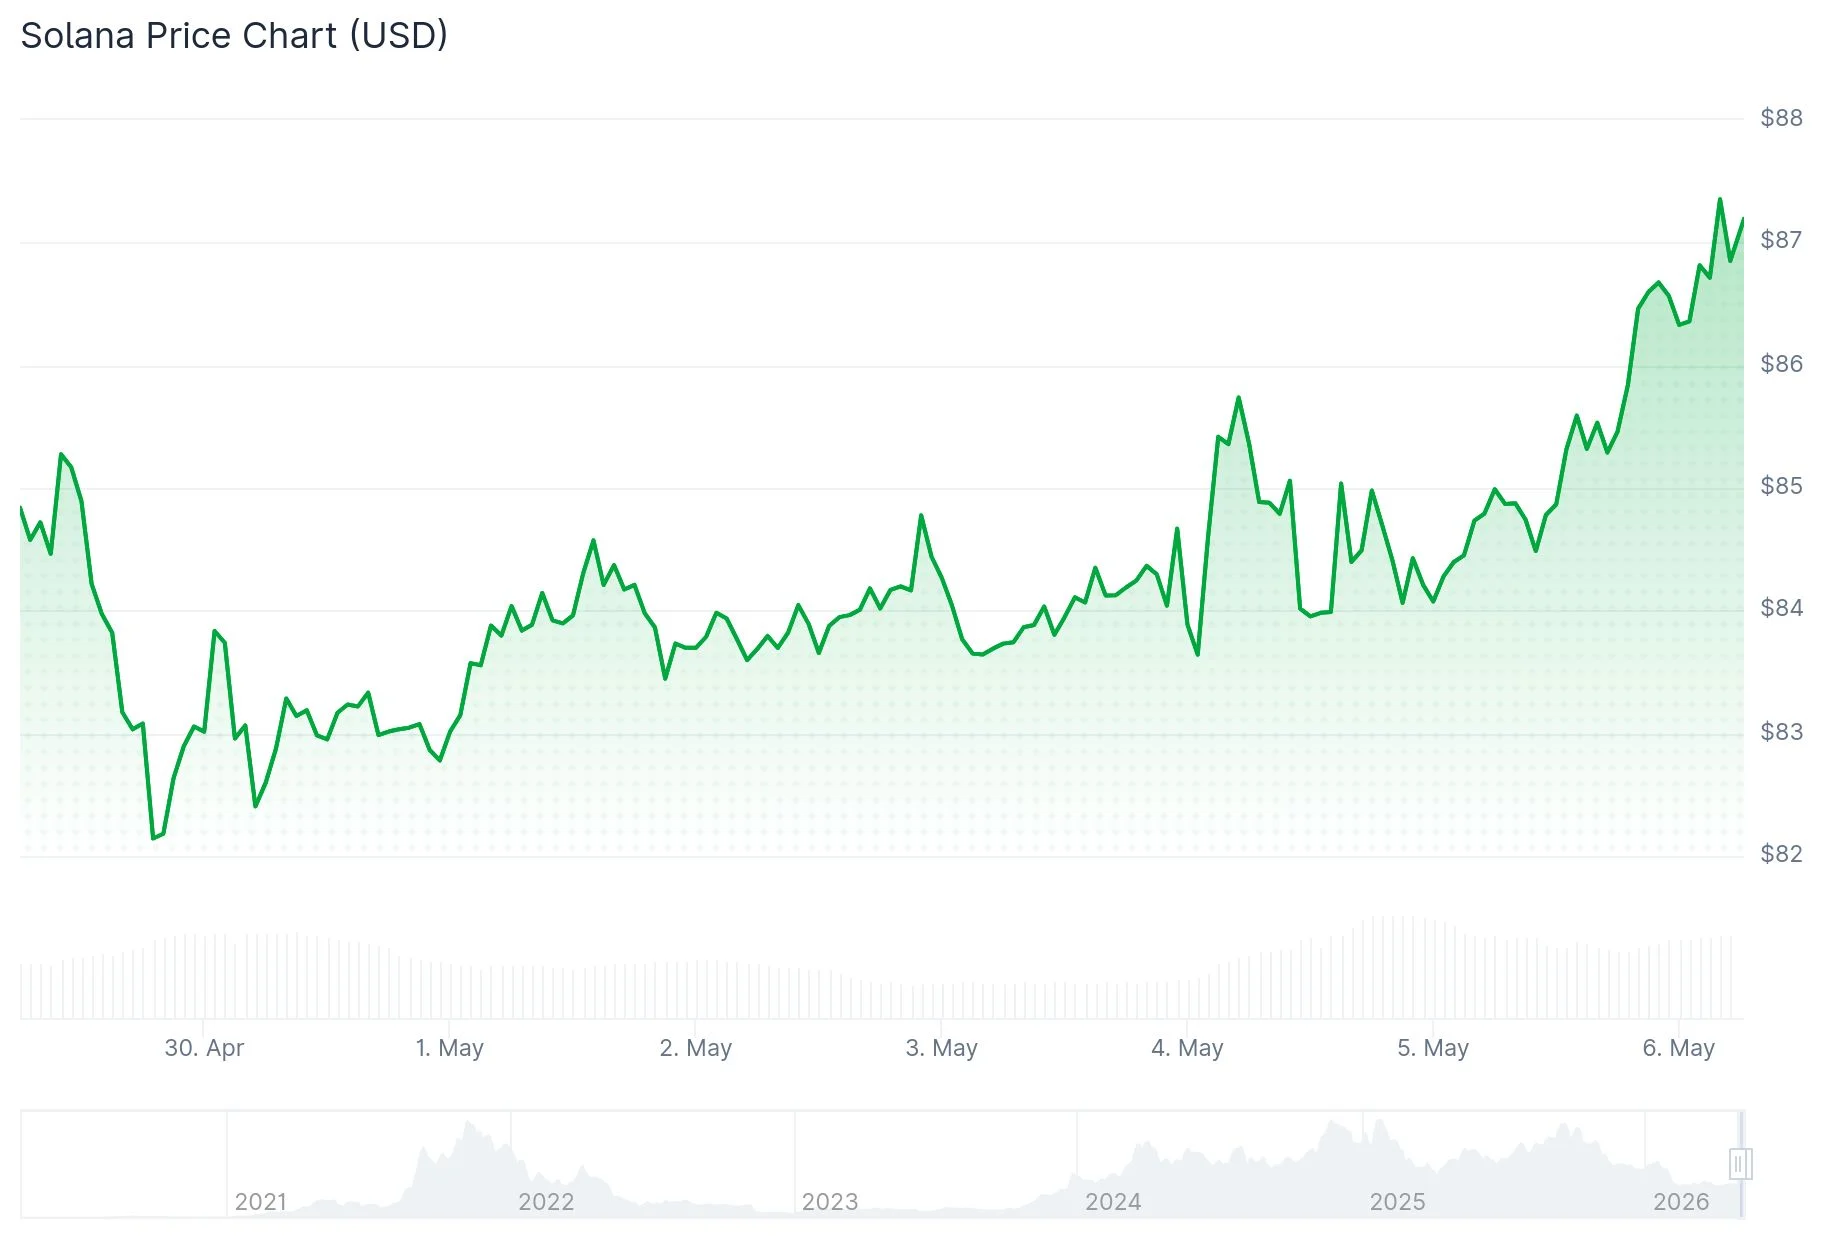
Chart specialists WebTrend and Ray have independently published technical studies identifying $100 as an achievable near-term objective should SOL overcome current overhead resistance. WebTrend’s analysis highlights two distinct rounded bottom formations — one developing near February’s nadir and another materializing in early April — indicating exhaustion among sellers within identical price territories.
Ray’s technical examination reveals SOL confined within a converging triangle structure, characterized by descending peaks and ascending troughs between approximately $70 and $97. According to Ray’s assessment, SOL should breach the $100 threshold “very soon,” contingent upon a decisive move above the triangle’s upper boundary near $85–$90.
A confirmed breakout above this trendline could propel prices toward the March peak around $97, followed by the psychologically significant $100 level. Ray’s projection also identifies $125 as a subsequent objective assuming SOL maintains gains above the breakout zone.
Technical Indicator Analysis
Market analyst Daan Crypto Trades provided additional perspective, highlighting SOL’s confinement within a 10% trading band spanning three months. According to his analysis, such extended compression phases generally precede substantial directional moves, with expectations for at minimum a 20–30% price shift once the range resolves. The ultimate direction hinges on which boundary fails first.

Technical momentum indicators support the consolidation thesis. The Relative Strength Index registers near 53, reflecting neutral market conditions. The Moving Average Convergence Divergence on daily timeframes remains flat without directional bias. The 200-period Exponential Moving Average positioned near $112 trades substantially above current levels, indicating persistent long-term bearish structure.
Derivatives metrics from CoinGlass indicate trading volume decreased approximately 37.88% during the past 24 hours, while open interest climbed 3.87%, suggesting continued position-building despite reduced trading activity. Aggregate liquidations totaled roughly $2.23 million over this period, with bearish positions accounting for approximately $1.84 million.
Blockchain Metrics Analysis
Santiment’s on-chain intelligence reveals Solana’s weekly active wallet count has contracted from a February high of 5.01 million to merely 2.89 million in recent weeks. Santiment observers note diminished wallet activity for SOL transfers. Conversely, social media sentiment has surged to peak levels last observed in January. Santiment metrics indicate approximately 3.2 optimistic mentions per single pessimistic comment across monitoring platforms including X, Reddit, and Telegram.
Primary resistance barriers exist at $90–$92 based on recent price behavior. Foundational support remains anchored near $80. Should SOL breach the triangle’s lower boundary around $80–$82, price action could revisit the $70–$75 zone.
SOL’s 200-period EMA currently stands at approximately $112, placing the token roughly 24% beneath this long-term moving average.
Get 3 Free Stock Ebooks
Discover top-performing stocks in AI, Crypto, and Technology with expert analysis.
- Top 10 AI Stocks - Leading AI companies
- Top 10 Crypto Stocks - Blockchain leaders
- Top 10 Tech Stocks - Tech giants

