



Key Highlights
- XRP dropped 1.38% to $1.37 on September 1 as surging Treasury yields pressured cryptocurrency markets
- Spot XRP ETFs in the US attracted $110.49 million in net inflows during the week ending August 28—the strongest weekly performance of 2026
- The 10-year US Treasury yield reached nearly 4.80%, diverting investment away from digital assets
- Technical analysts warn a break below $1.34 could push XRP toward $1.30, with $1.20 as a secondary downside target
- Wave theory suggests a potential climb to $2.90–$3.10, though a correction phase may need to complete first
On September 1, XRP declined 1.38% to settle at $1.3592, retreating from its August gains as climbing US government bond yields prompted investors to reduce exposure to higher-risk digital currencies.
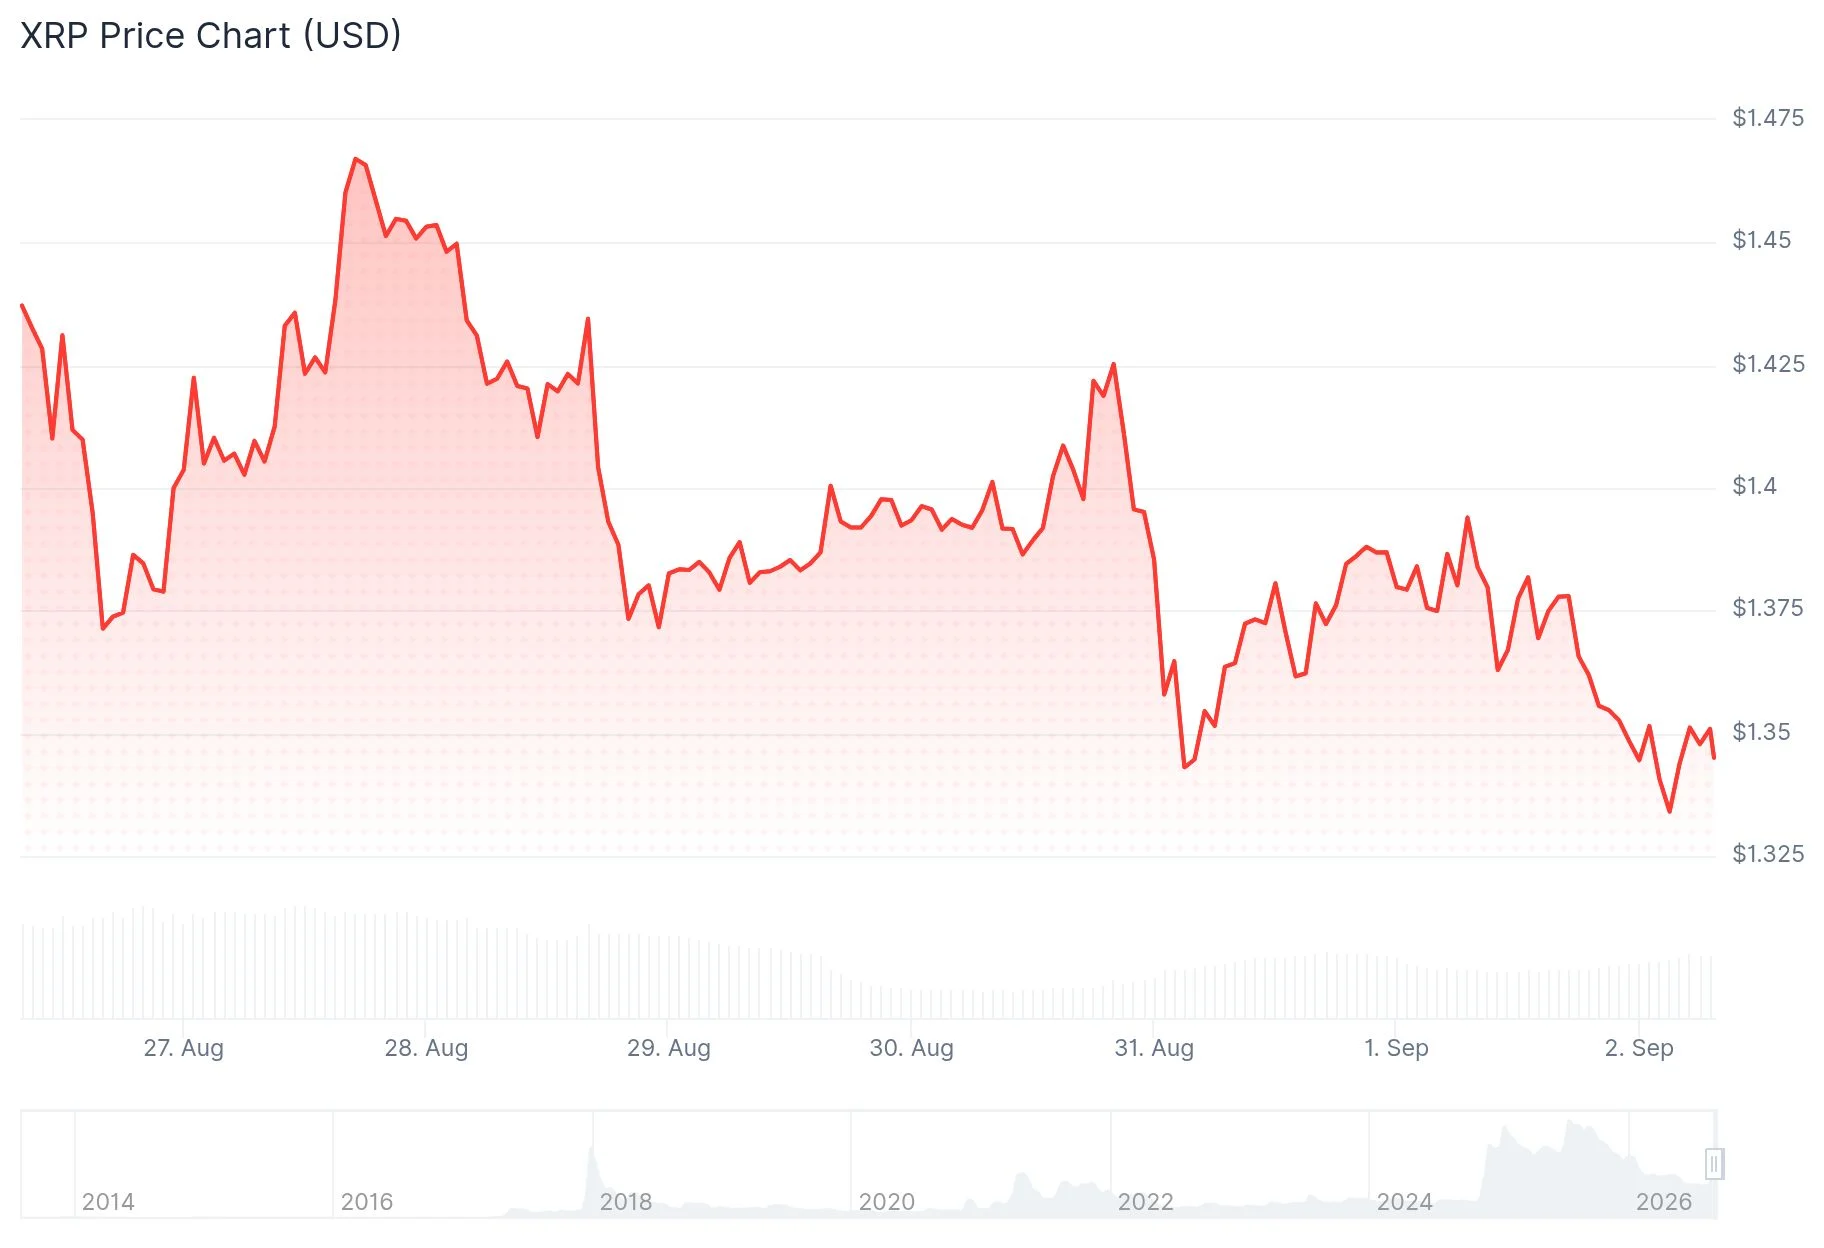
The cryptocurrency briefly rallied to $1.69 in August before momentum faded. Since then, it has consolidated within a narrow band spanning $1.35 to $1.40.
While the price retreated, institutional interest via US-listed spot XRP exchange-traded funds stayed robust. During the week that concluded on August 28, these products collected net inflows totaling $110.49 million—marking the strongest weekly accumulation recorded this year.
The final trading day of August saw $5.64 million in daily inflows. Canary’s XRPC fund captured $4.71 million of that total, while Bitwise contributed approximately $930,000.
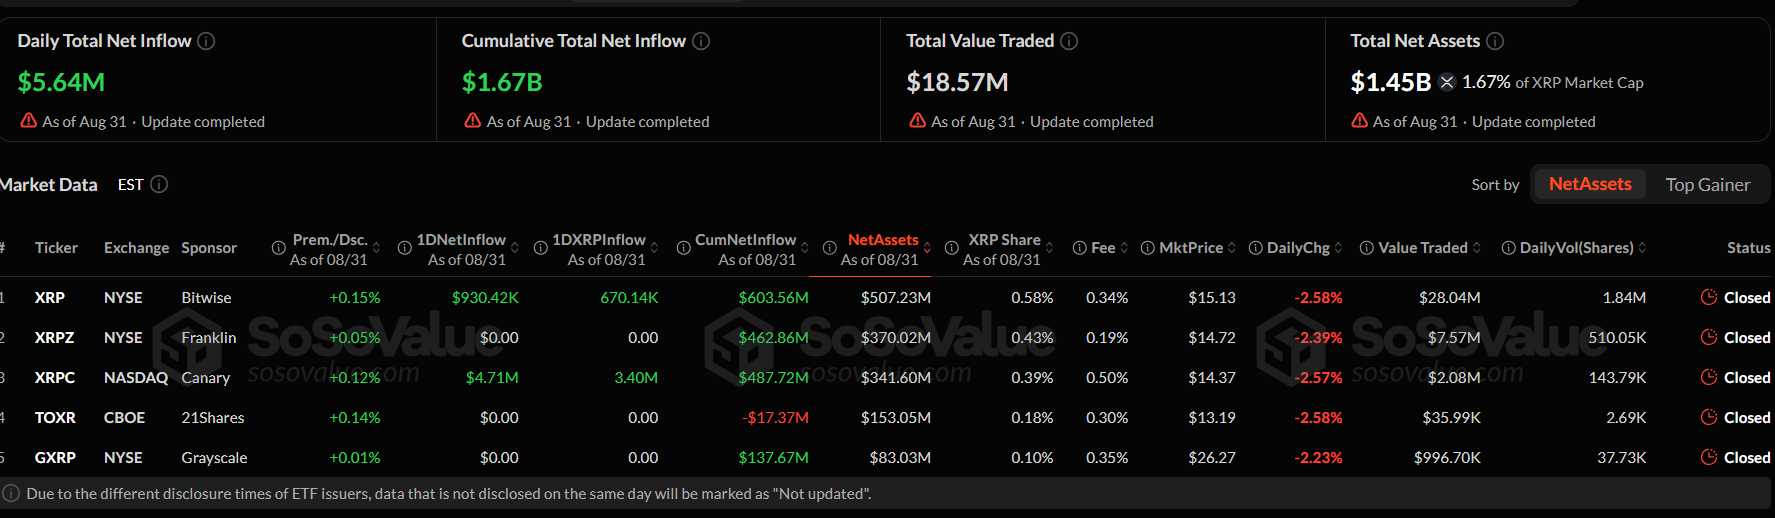
Combined ETF holdings now total $1.45 billion, representing roughly 1.67% of XRP’s approximately $85 billion market capitalization. Bitwise commands the largest fund position at $507.23 million, trailed by Franklin with $370.02 million and Canary holding $341.60 million.

The benchmark 10-year Treasury yield approached 4.80%, reaching levels not seen since early 2025. As traditional fixed-income instruments deliver stronger returns, capital typically flows away from speculative cryptocurrency positions.
Market analyst XRP Update shared on X that the token is “running out of room,” highlighting how the 4-hour timeframe shows compression between support around $1.35 and falling resistance near $1.40. According to the analyst, a decisive breakout from this pattern could determine the next substantial price movement.
Technical Indicator Breakdown
The Relative Strength Index registered 39.56, sitting below the midpoint yet above oversold conditions. The MACD indicator showed -0.0088, hovering marginally above its signal line positioned near -0.0090.
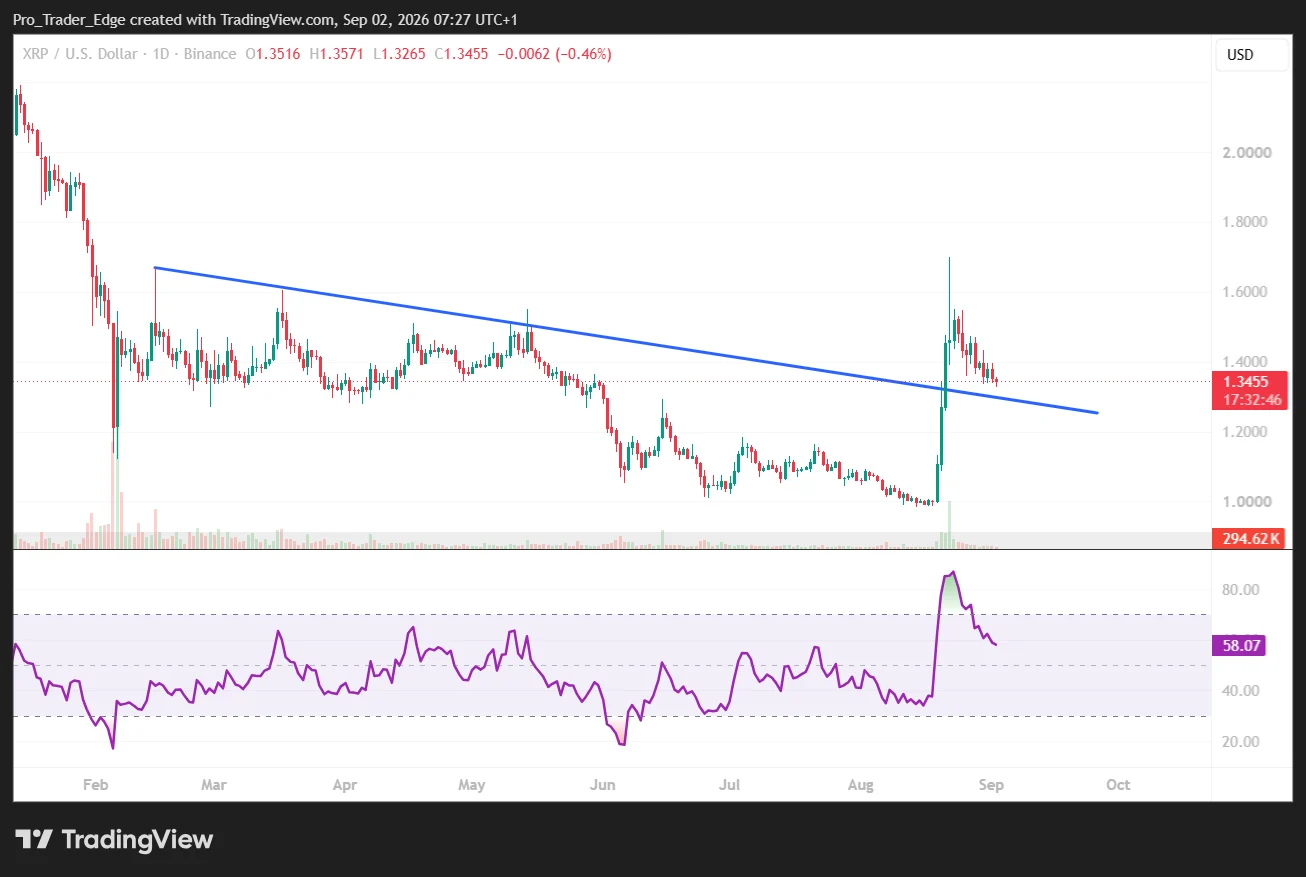
A decisive close beneath $1.34 would likely clear the path toward $1.30. Should downward momentum intensify, the $1.20 zone emerges as the subsequent critical level.
Conversely, recovery above $1.38 could redirect XRP toward $1.50, with $1.60 representing an extended bullish objective.
Wave Pattern Projections and Legislative Developments
Technical analyst Kap_Waves on TradingView outlined a possible Wave 2 retracement pattern, suggesting a downward adjustment toward the $1.15–$1.25 range before any sustained rally. The framework identifies potential Wave 3 objectives at $2.90 and $3.10, though this represents a theoretical roadmap rather than a guaranteed trajectory.
Senator Kevin Cramer expressed optimism about the CLARITY Act’s prospects ahead of the scheduled September 15 Senate vote. Prediction markets on Kalshi assigned a 91% likelihood to a Senate vote occurring before October, whereas Polymarket participants estimated only a 13% chance the legislation would be enacted into law during 2026.
Additionally, the Securities and Exchange Commission introduced proposed regulations designed to facilitate blockchain integration within securities settlement processes—a move that could represent regulatory advancement even as congressional crypto policy discussions continue.
XRP was trading at $1.39 according to the most recent available data.
Get 3 Free Stock Ebooks
Discover top-performing stocks in AI, Crypto, and Technology with expert analysis.
- Top 10 AI Stocks - Leading AI companies
- Top 10 Crypto Stocks - Blockchain leaders
- Top 10 Tech Stocks - Tech giants


