



Key Highlights
- BNB currently trades near $605, challenging the critical $600 resistance zone following a bounce from $540 support levels
- Historical data reveals that just 19.3% of BNB’s total trading sessions since inception have settled above the $600 mark
- Technical analyst Crypto Patel highlights $607.6 as a critical decision point, suggesting a successful breach could drive prices toward $700–$750
- The BNB Chain network saw tokenized stock market capitalization surge by $164.5 million during the last 30-day period
- Technical indicators suggest a 59% likelihood of bearish movement unless the token recaptures the $612–$613 zone
As of August 17, 2026, Binance Coin (BNB) maintains its position around the $605 mark, occupying a price zone that represents relatively rare territory throughout the token’s trading history.
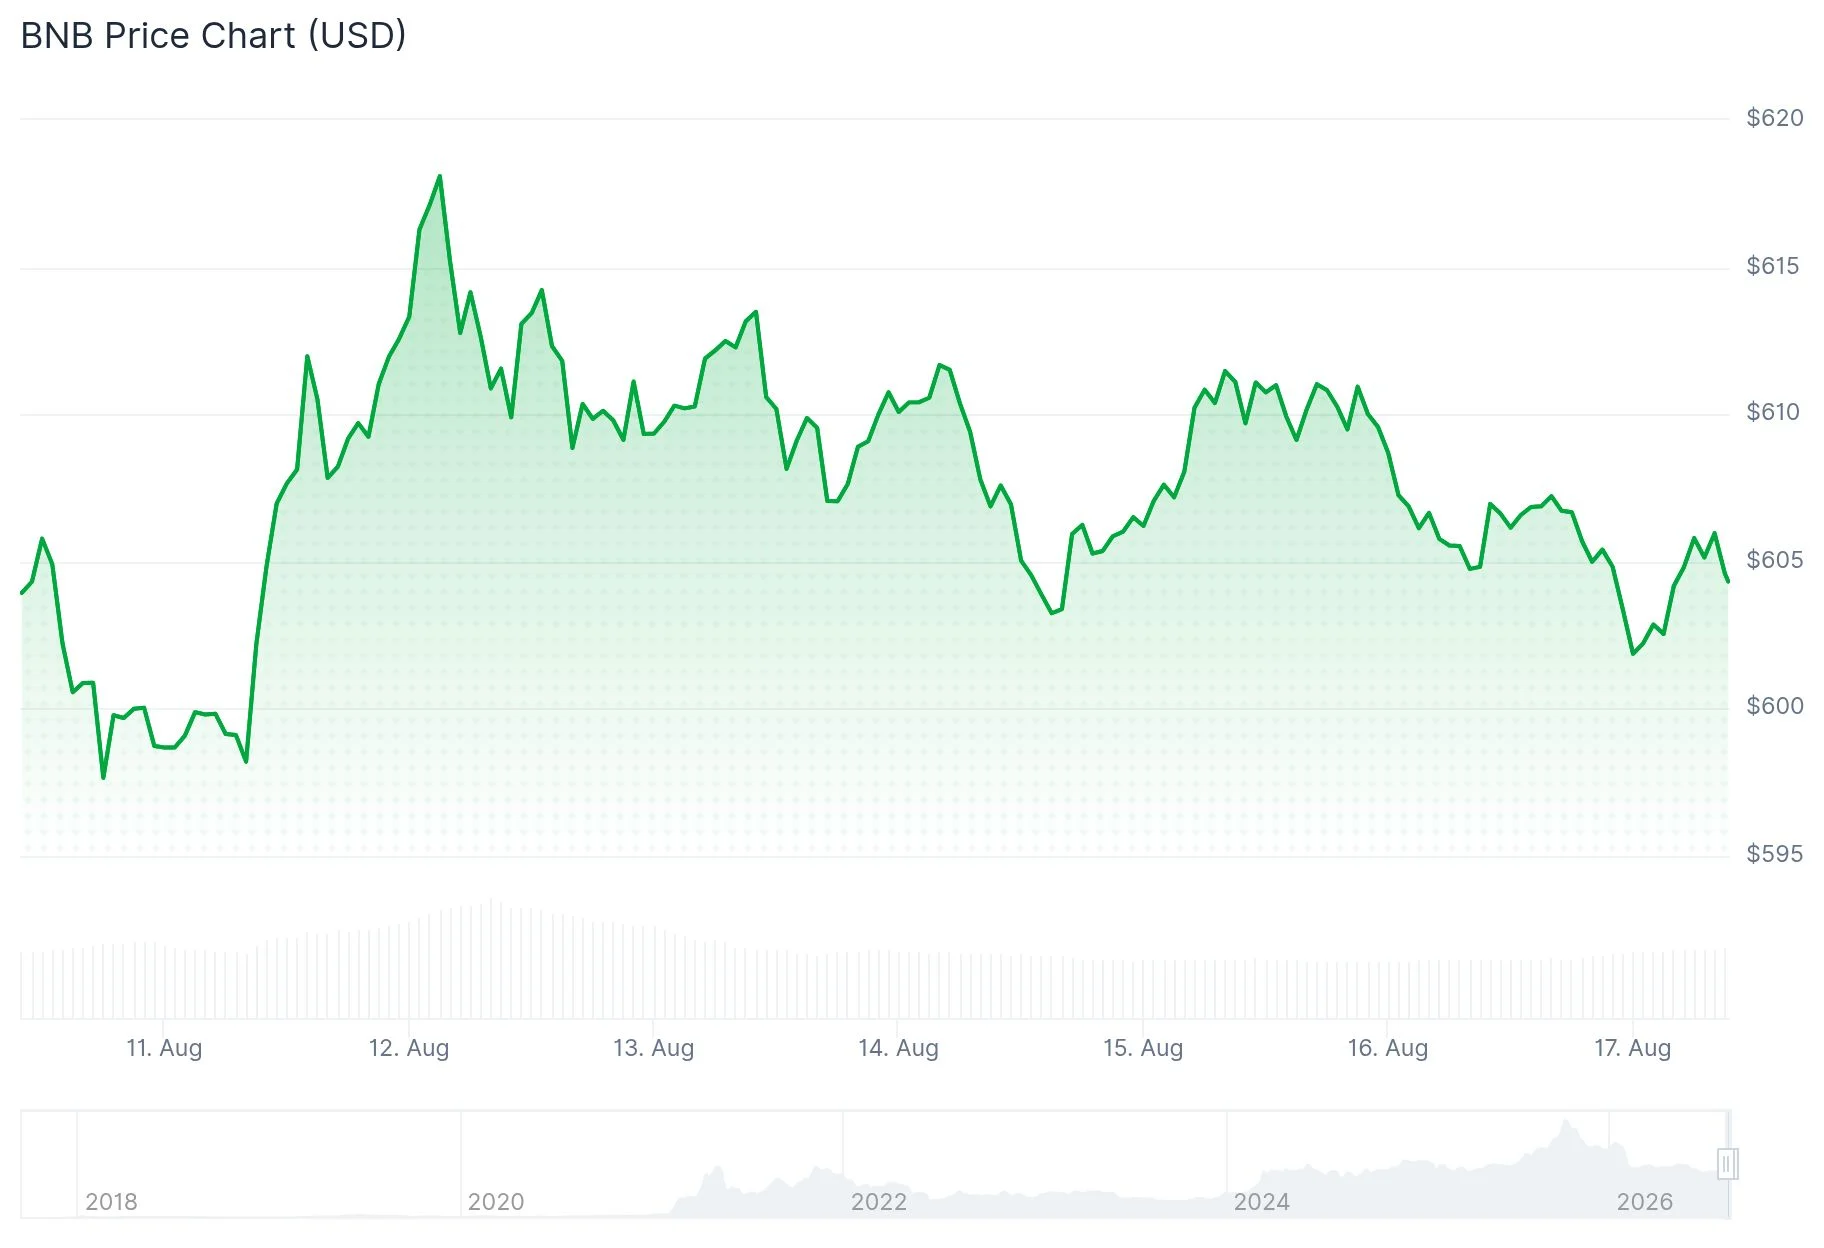
Data analysis from MSBIntel reveals that throughout approximately 3,200 trading sessions since its initial launch, BNB has managed to close above the $600 threshold on merely 19.3% of those days. This statistic underscores the significance of current price levels.
Throughout 2022 and the majority of 2023, BNB remained significantly beneath the $600 mark. Historical records from CoinLore indicate the token maintained an average price near $267 during 2023, subsequently climbing to approximately $543 throughout 2024 and reaching $772 during 2025.
The digital asset achieved its record high approaching $1,370 in October 2025. Following this peak, the token experienced a correction, positioning the present $600 level as a significant midpoint between the 2025 summit and earlier historical price ranges.
Current market metrics show BNB registering a 24-hour transaction volume of $600.35 million alongside a total market capitalization standing at $80.58 billion.

Technical Experts Focus on $607 Critical Zone
On August 13, cryptocurrency analyst Crypto Patel shared observations indicating BNB is consolidating within an upward-sloping channel pattern following rejection at the $620.5 supply area. The analyst pinpointed $607.6 as the crucial pivot point, where horizontal support intersects with the ascending trendline. Patel’s analysis suggests that maintaining this level could support another attempt toward $620 with extended targets reaching $700–$750. Conversely, breaking below $607 might trigger declines toward $595, followed by $587, and ultimately $580.
Market analyst Crypto TXG observed that maintaining a weekly closing price above $600 could establish a trajectory toward the $660–$700 range. Should this level fail to hold, BNB might continue trading sideways, with $540 representing the primary support foundation.
Additional near-term technical evaluation from X user @TyumaBidrouINW positioned BNB at $610.65, marking the $605–$614.99 range as a key reaction area. This assessment allocated a 59% probability weighting toward downside movement compared to 29% for upward continuation, contingent upon price action failing to reclaim the $612.18–$613.23 territory.
BNB Chain Dominates in Tokenized Equity Expansion
From a network perspective, BNB Chain demonstrated the most substantial growth in tokenized stock market capitalization among prominent blockchain platforms during the previous 30-day window. Token Terminal’s metrics indicate BNB Chain accumulated $164.5 million in additional tokenized equity value. During this identical timeframe, Solana registered $69.5 million in growth while Arbitrum One contributed $44 million.
BNB presently trades in the vicinity of $605, with market participants on both sides closely monitoring whether a sustained weekly settlement above $600 can be maintained.
Get 3 Free Stock Ebooks
Discover top-performing stocks in AI, Crypto, and Technology with expert analysis.
- Top 10 AI Stocks - Leading AI companies
- Top 10 Crypto Stocks - Blockchain leaders
- Top 10 Tech Stocks - Tech giants


