



Key Takeaways
- BTC plummeted from $79,500 to sub-$76,000 levels, triggering approximately $547 million in total liquidations
- Leveraged long traders suffered the most damage, with over $659 million in forced liquidations within a single 24-hour period
- Bitcoin spot ETFs in the United States recorded $307.45 million in net inflows on August 21, marking five consecutive days of positive flows
- Technical analysts identify potential downside targets ranging from $71,000 down to $68,000 if bearish momentum persists
- Critical macroeconomic data releases including PCE inflation numbers, Nvidia’s quarterly results, and Jerome Powell’s Jackson Hole speech could determine BTC’s trajectory
Bitcoin experienced a steep decline from approximately $79,500 — representing its strongest price level in recent months — down to levels beneath $76,000 in a sudden selloff that blindsided highly leveraged market participants. The abrupt downturn resulted in roughly $547 million worth of cryptocurrency liquidations before demand returned to stabilize prices.
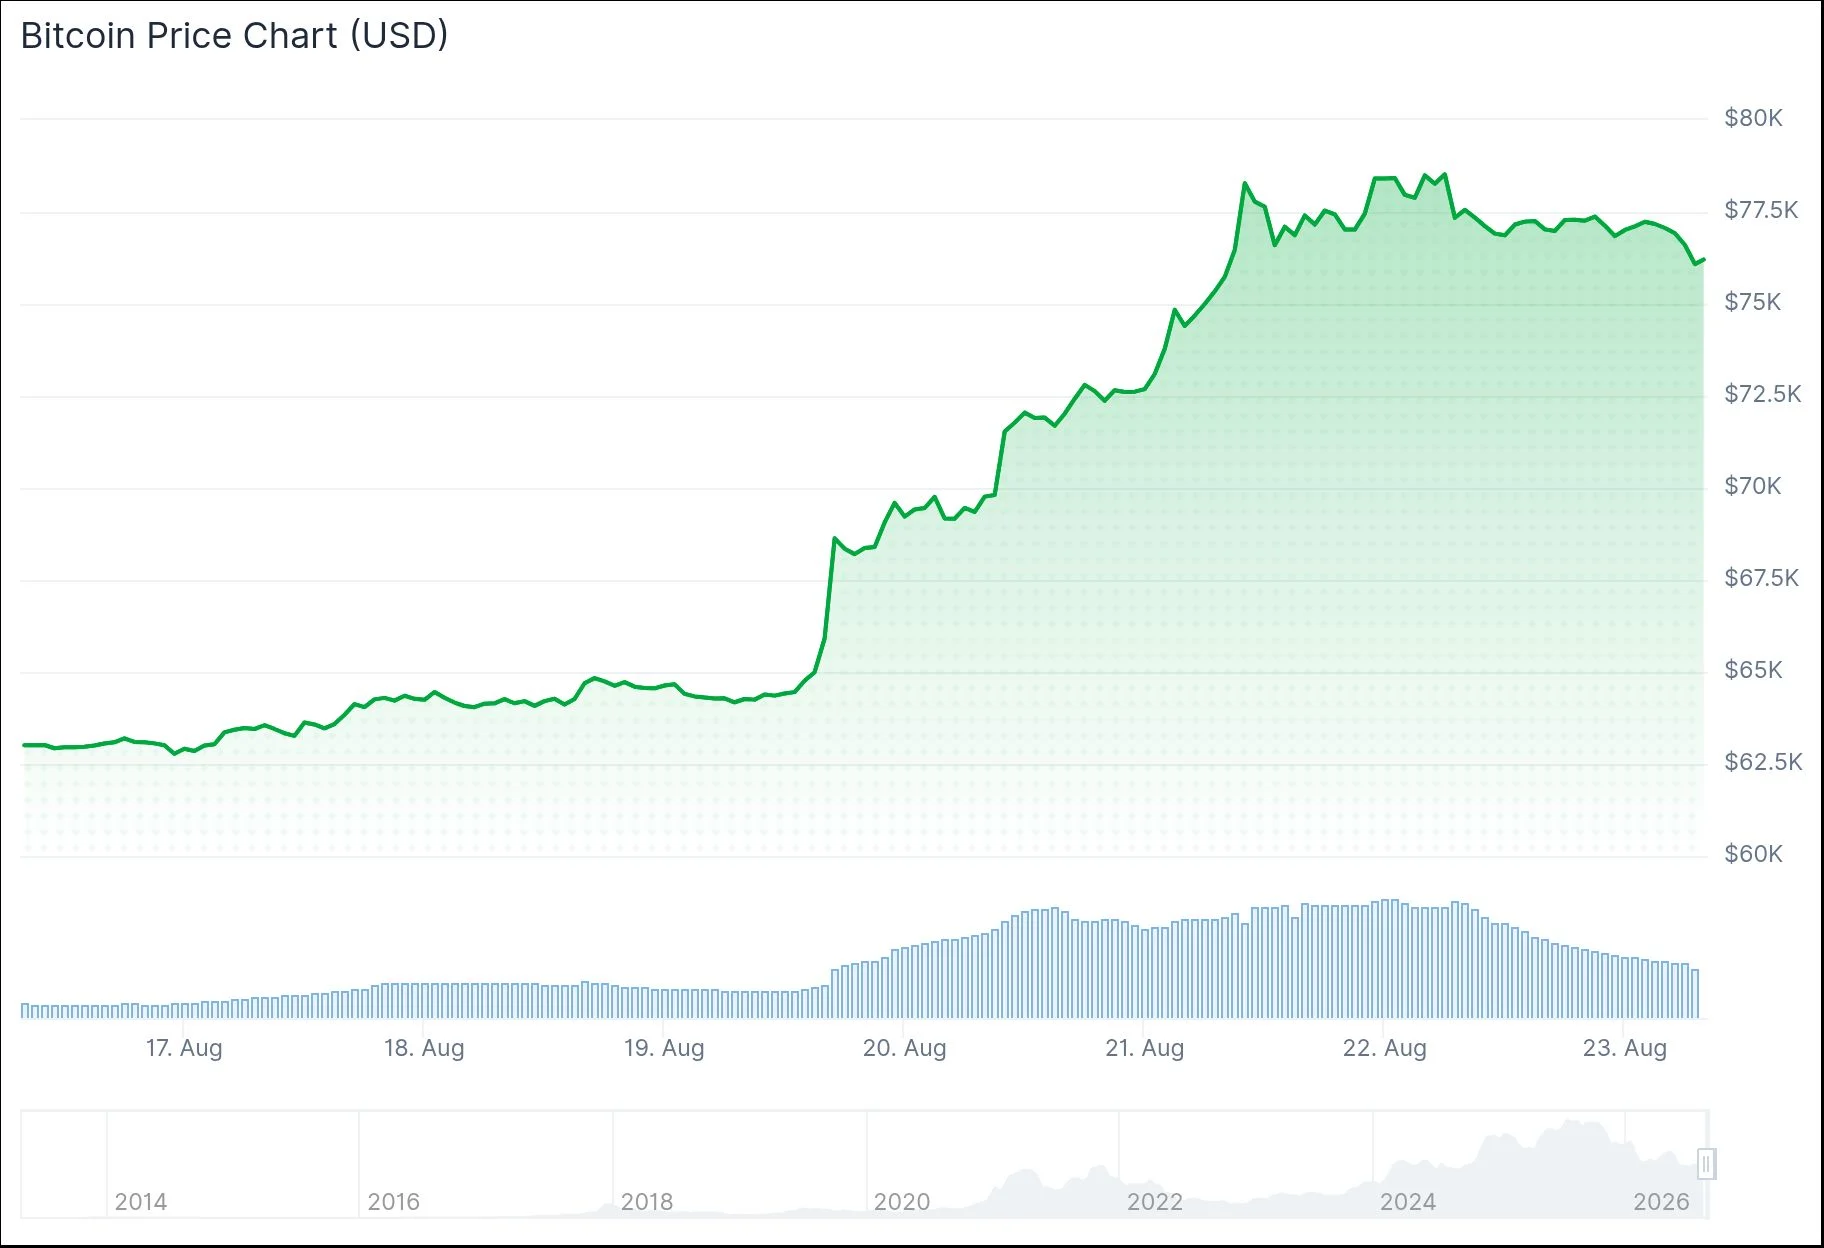
During the current session, BTC was changing hands near $77,291, reflecting a 0.43% decline.
The sharp correction revealed underlying market fragility. Bullish positions absorbed the majority of losses, representing approximately $659 million in forced liquidations versus only $148 million on bearish positions — demonstrating a more than 4:1 ratio skewed toward long closures.
On trading venues such as Hyperliquid, individual long position liquidations reached magnitudes between $23 million and $48 million, highlighting the extreme exposure held by certain market participants.
Blockchain analyst Maartunn identified excessive bullish positioning as the primary catalyst. As Bitcoin descended into liquidation territory, cascading forced selling intensified the downward move. Maartunn observed that liquidity clusters are currently forming above the $78,300 threshold, with additional concentrations positioned lower around the $68,000 zone.

Technical Outlook From Market Observers
Technical analyst P4 Provider identified $79,000 as a critical resistance barrier following Bitcoin’s liquidity sweep above that threshold. P4 Provider also highlighted bearish RSI divergence patterns, increasing USDT dominance metrics, and elevated perpetual funding rates as concerning indicators. Potential downside objectives span from $77,000 to $71,000, with $70,000 representing a more substantial support zone should selling intensify.
Cryptocurrency market analyst Daan Crypto Trades (@DaanCrypto) observed through social channels that the present weekly Bitcoin candle ranks within the top 5% of largest candles witnessed over the previous eight years. He emphasized that the monthly candle appears less overextended, positioning in the 32nd percentile range. Daan further mentioned that historically, 61% of bullish monthly periods see their highs established later in the month — implying the current peak might still be challenged, though he stressed no outcome is guaranteed.
Such liquidation cascades have historical precedent. During May, when Bitcoin tumbled below $75,000, total liquidations reached approximately $923 million, with bullish positions accounting for more than 90% of the destruction.
Upcoming Macroeconomic Catalysts
Notwithstanding the recent price action, institutional demand indicators persist. United States spot Bitcoin ETF products recorded $307.45 million in net positive flows on August 21, continuing a five-day consecutive inflow pattern.
On August 26, the United States Bureau of Economic Analysis is scheduled to publish second-quarter GDP figures alongside July PCE inflation metrics. Nvidia’s quarterly earnings report is also due that date. Federal Reserve Chair Kevin Warsh delivers remarks at the Jackson Hole Economic Symposium on August 28.
Maintaining support above $77,000 represents the near-term priority for bullish market participants.
Get 3 Free Stock Ebooks
Discover top-performing stocks in AI, Crypto, and Technology with expert analysis.
- Top 10 AI Stocks - Leading AI companies
- Top 10 Crypto Stocks - Blockchain leaders
- Top 10 Tech Stocks - Tech giants


