



Key Takeaways
- BTC maintains support around $86,000 following a peak at $87,350, marking a 33-week high.
- Crude oil prices temporarily dipped under $90 per barrel, potentially relieving inflation pressures tied to energy markets.
- On-chain indicator MVRV ratio has surpassed its 365-day average, echoing patterns observed during 2019 and 2023 rallies.
- Bitcoin is positioned for its first consecutive July-September positive performance since 2012.
- Market observer Ted Pillows identifies $87,000-$88,000 as critical overhead resistance, while $79,000-$80,000 could provide downside support.
Bitcoin (BTC) maintained its position around the $86,000 mark on Tuesday following a surge to its strongest level in approximately eight months.
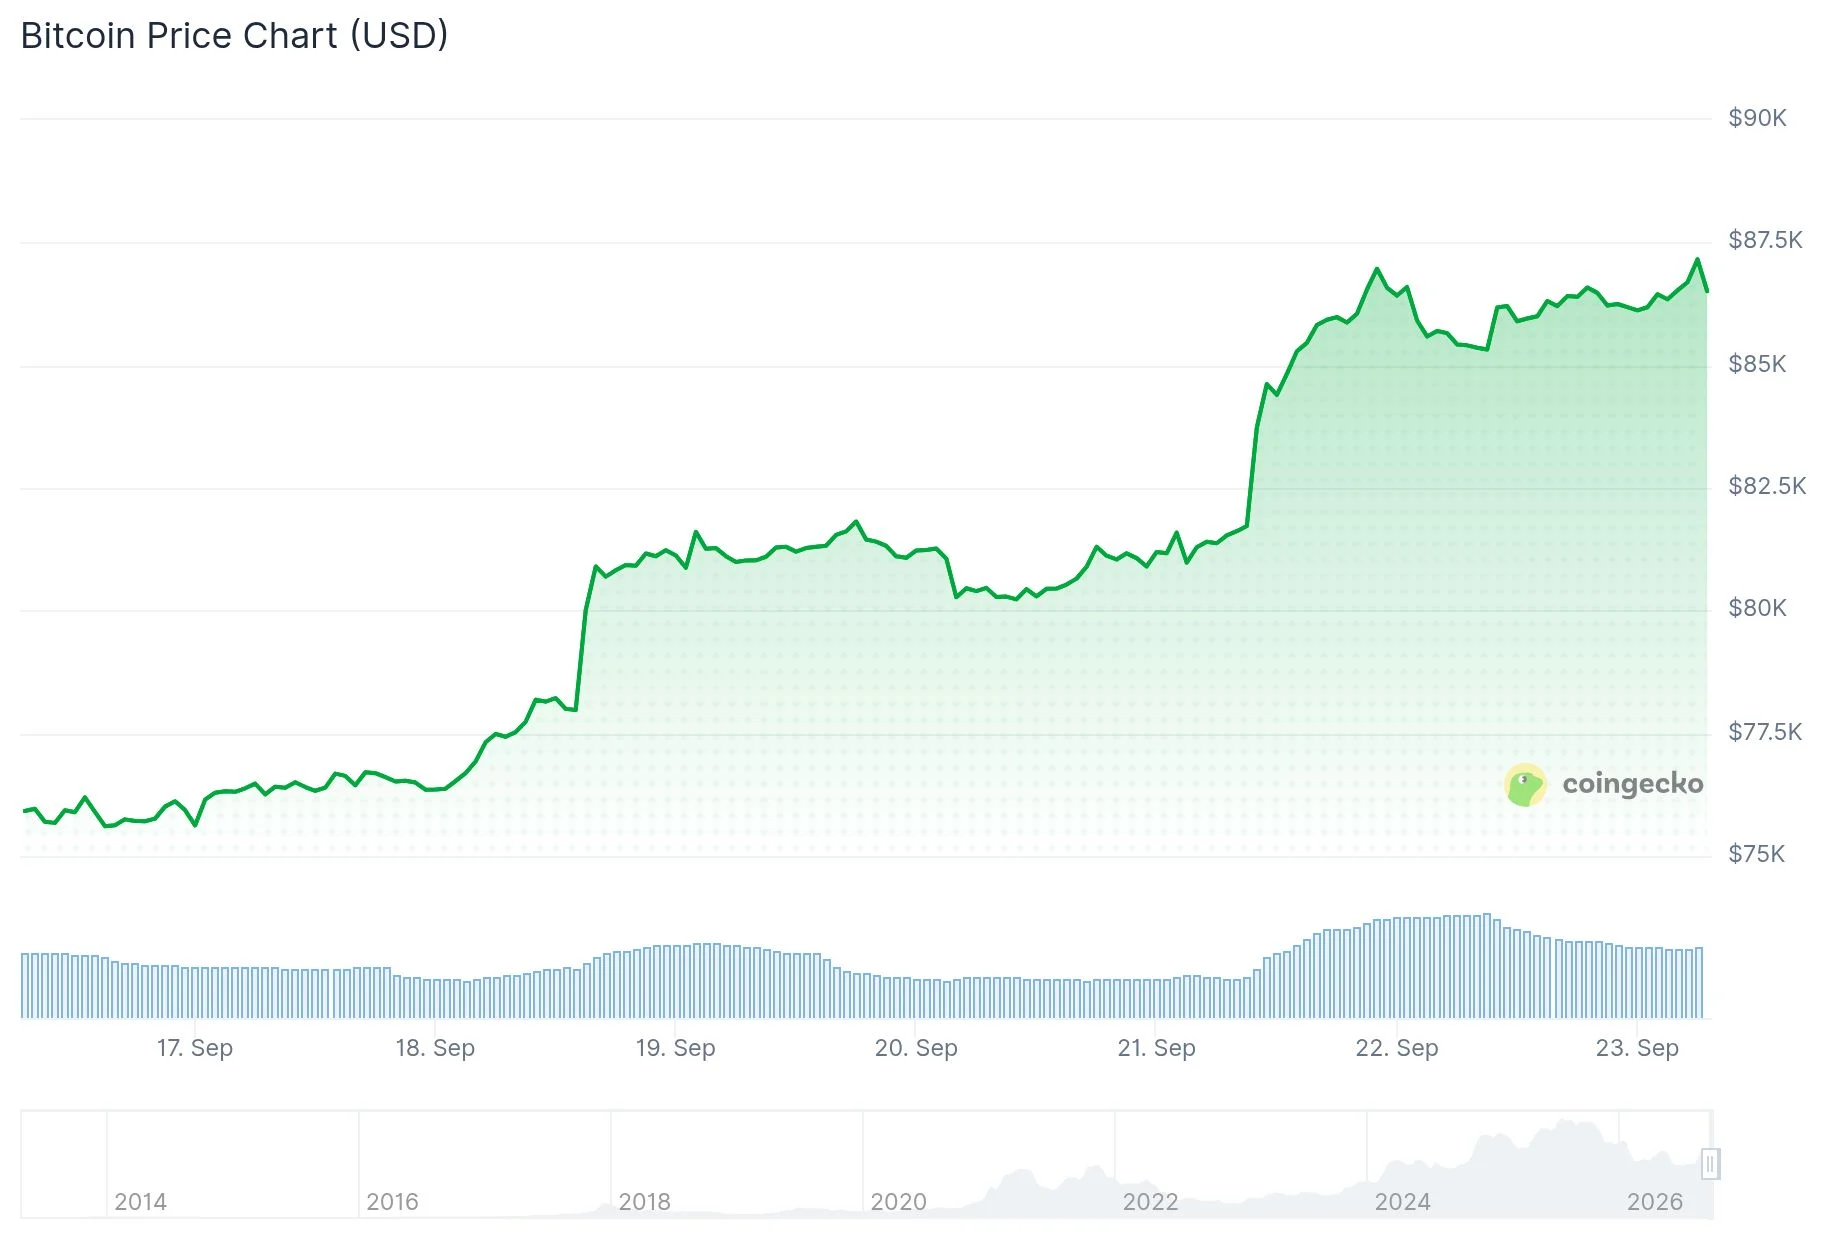
The leading cryptocurrency peaked at $87,350 during Monday’s trading session before the upward momentum began to ease. Despite this cooling, support has held firm, preventing any significant retreat beneath the $86,000 threshold.
This current rally has pushed bitcoin to approximately 10.9% gains for September. This performance follows increases of 4.8% in July and a substantial 25.2% surge in August.
Should September close in positive territory, it would represent bitcoin’s first three-consecutive-month winning sequence from July through September since 2012.
Traders are simultaneously monitoring movements in energy markets. West Texas Intermediate crude temporarily declined to $89.16 per barrel, representing its weakest point since early September.

The oil decline followed news that Saudi Arabia had restored operations on its East-West Pipeline. Prices subsequently rebounded toward the $92 level.
On-chain indicators signal strengthening bullish momentum
Bitcoin’s Market Value to Realized Value (MVRV) ratio has climbed above its 365-day moving average.
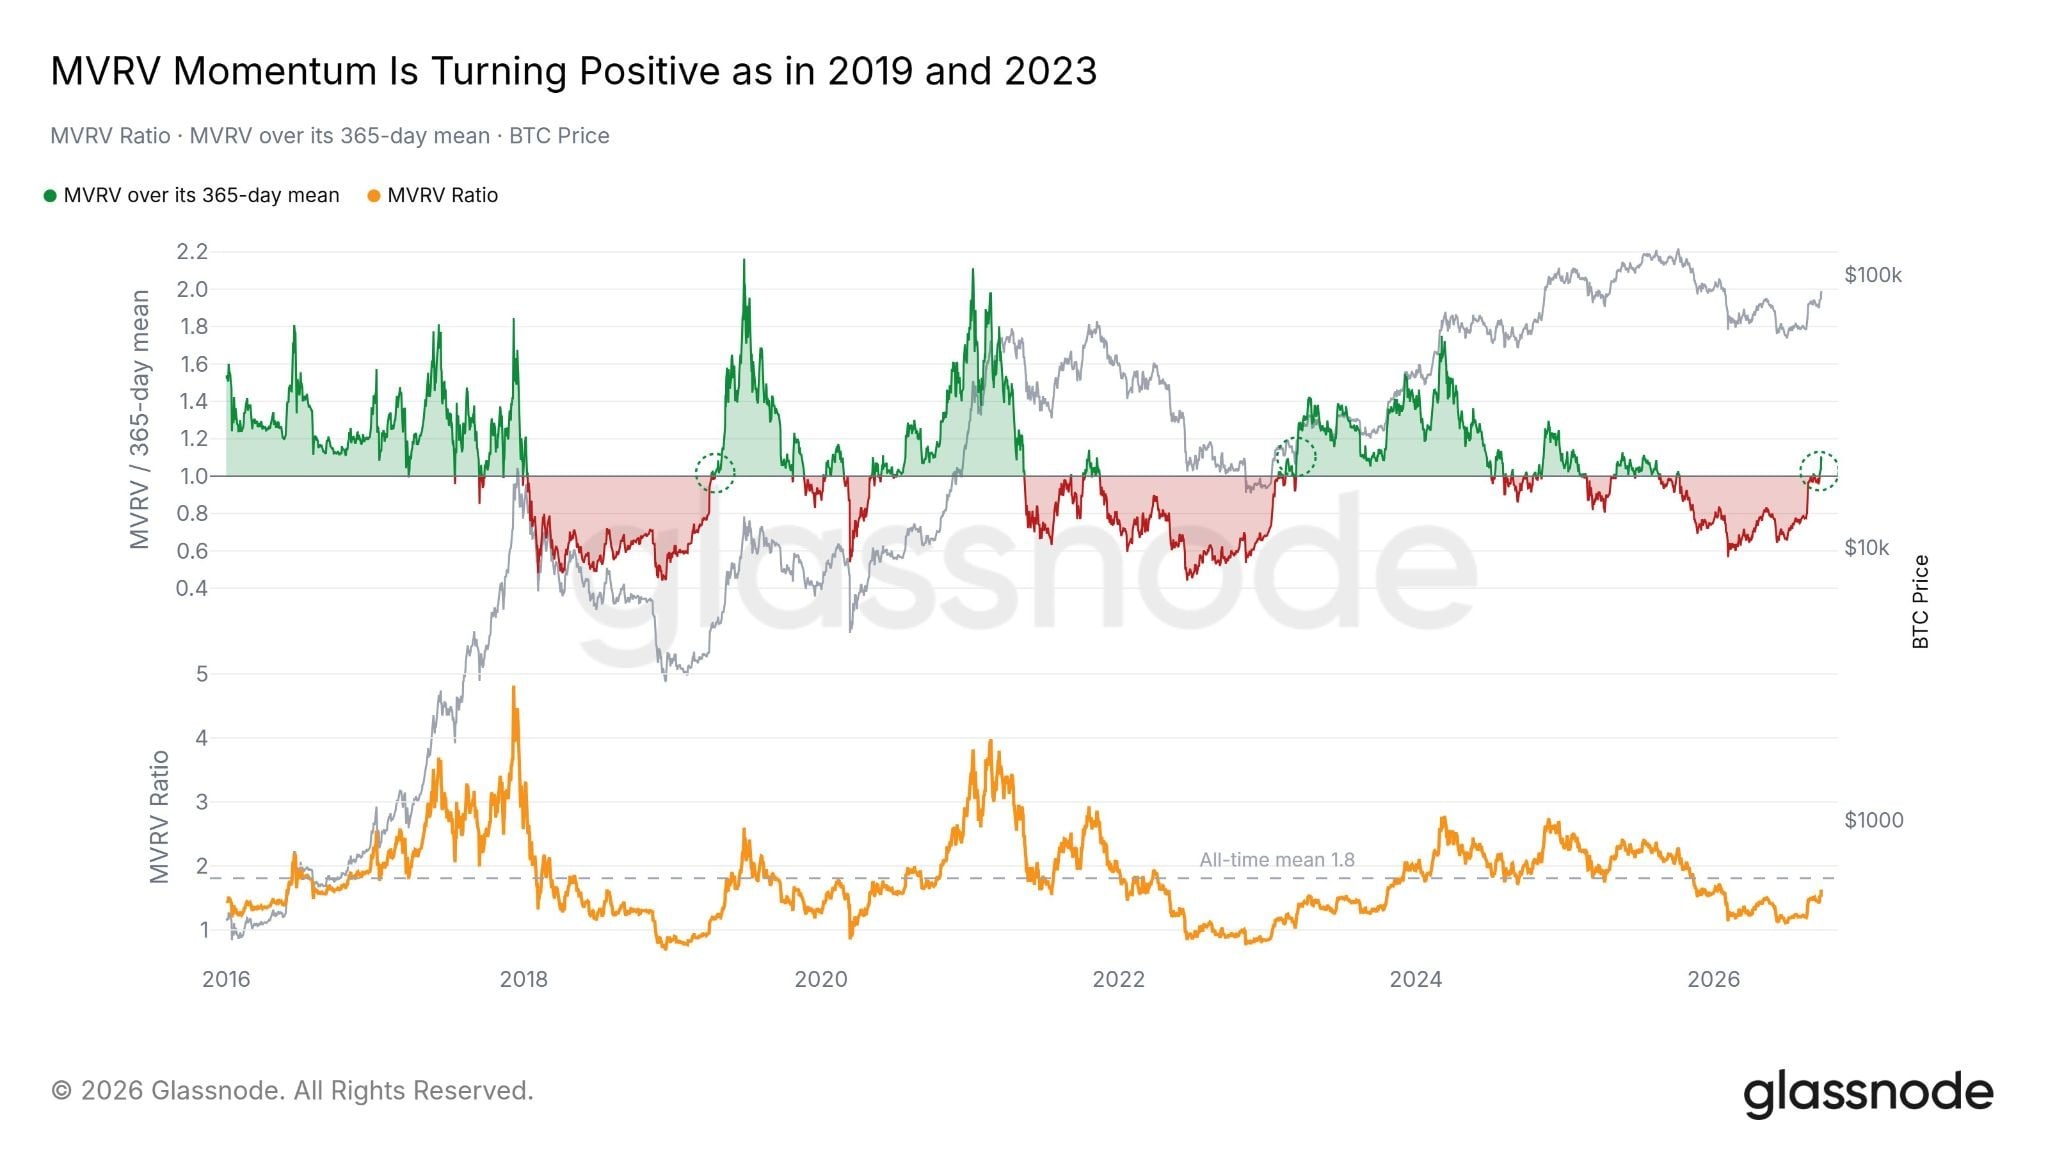
The metric currently registers approximately 1.62, representing a significant jump from the 1.19 level recorded on August 16. Comparable crossovers preceded the initiation of bullish market cycles in both 2019 and 2023.
The MVRV ratio measures the relationship between bitcoin’s current market capitalization and the aggregate value at which all coins last transferred on the blockchain. Elevated readings typically indicate holders are experiencing larger unrealized gains.
The present 1.62 figure remains considerably below the 3.7 threshold that has historically coincided with previous cycle tops.
An additional MVRV calculation utilizing the 30-day moving average is similarly nearing a significant threshold. A breakthrough above 1.5 would represent the first such occurrence since January.
Critical resistance zone emerges around $88,000
Cryptocurrency analyst Ted Pillows drew attention to the $87,000-$88,000 range in commentary shared on X.
Pillows emphasized this zone’s significance due to its proximity to bitcoin’s yearly opening price, suggesting it may function as meaningful resistance. He noted that any pullback could redirect attention toward the $79,000-$80,000 area as potential support.
Bitcoin’s ongoing monthly winning streak is attracting considerable attention given its historical infrequency. The cryptocurrency’s only prior consecutive July, August, and September gains occurred in 2012.
That historical precedent saw a declining October before bitcoin eventually mounted a powerful rally. Nevertheless, a single data point provides insufficient evidence to establish a reliable recurring pattern.
President Donald Trump also indicated to the United Nations that he anticipates reaching an agreement to resolve tensions with Iran, potentially following November’s midterm elections.
For the immediate term, bitcoin continues trading near $86,000 after touching $87,350, with the $87,000-$88,000 range remaining the primary resistance area under market surveillance.
Get 3 Free Stock Ebooks
Discover top-performing stocks in AI, Crypto, and Technology with expert analysis.
- Top 10 AI Stocks - Leading AI companies
- Top 10 Crypto Stocks - Blockchain leaders
- Top 10 Tech Stocks - Tech giants


