



Key Takeaways
- BTC surged to $65,500 on July 15, marking its strongest level since late June
- Producer Price Index registered 5.5% annually with a 0.3% monthly drop, surpassing forecasts
- Market expectations for a September Federal Reserve rate increase shifted significantly
- BTC stabilized around $64,830 on July 16 amid escalating U.S.-Iran geopolitical concerns
- Market participants identify $67,200 as critical resistance for potential breakout toward $70,000
Bitcoin surged to a three-week peak midweek following back-to-back U.S. inflation reports that came in below market expectations.
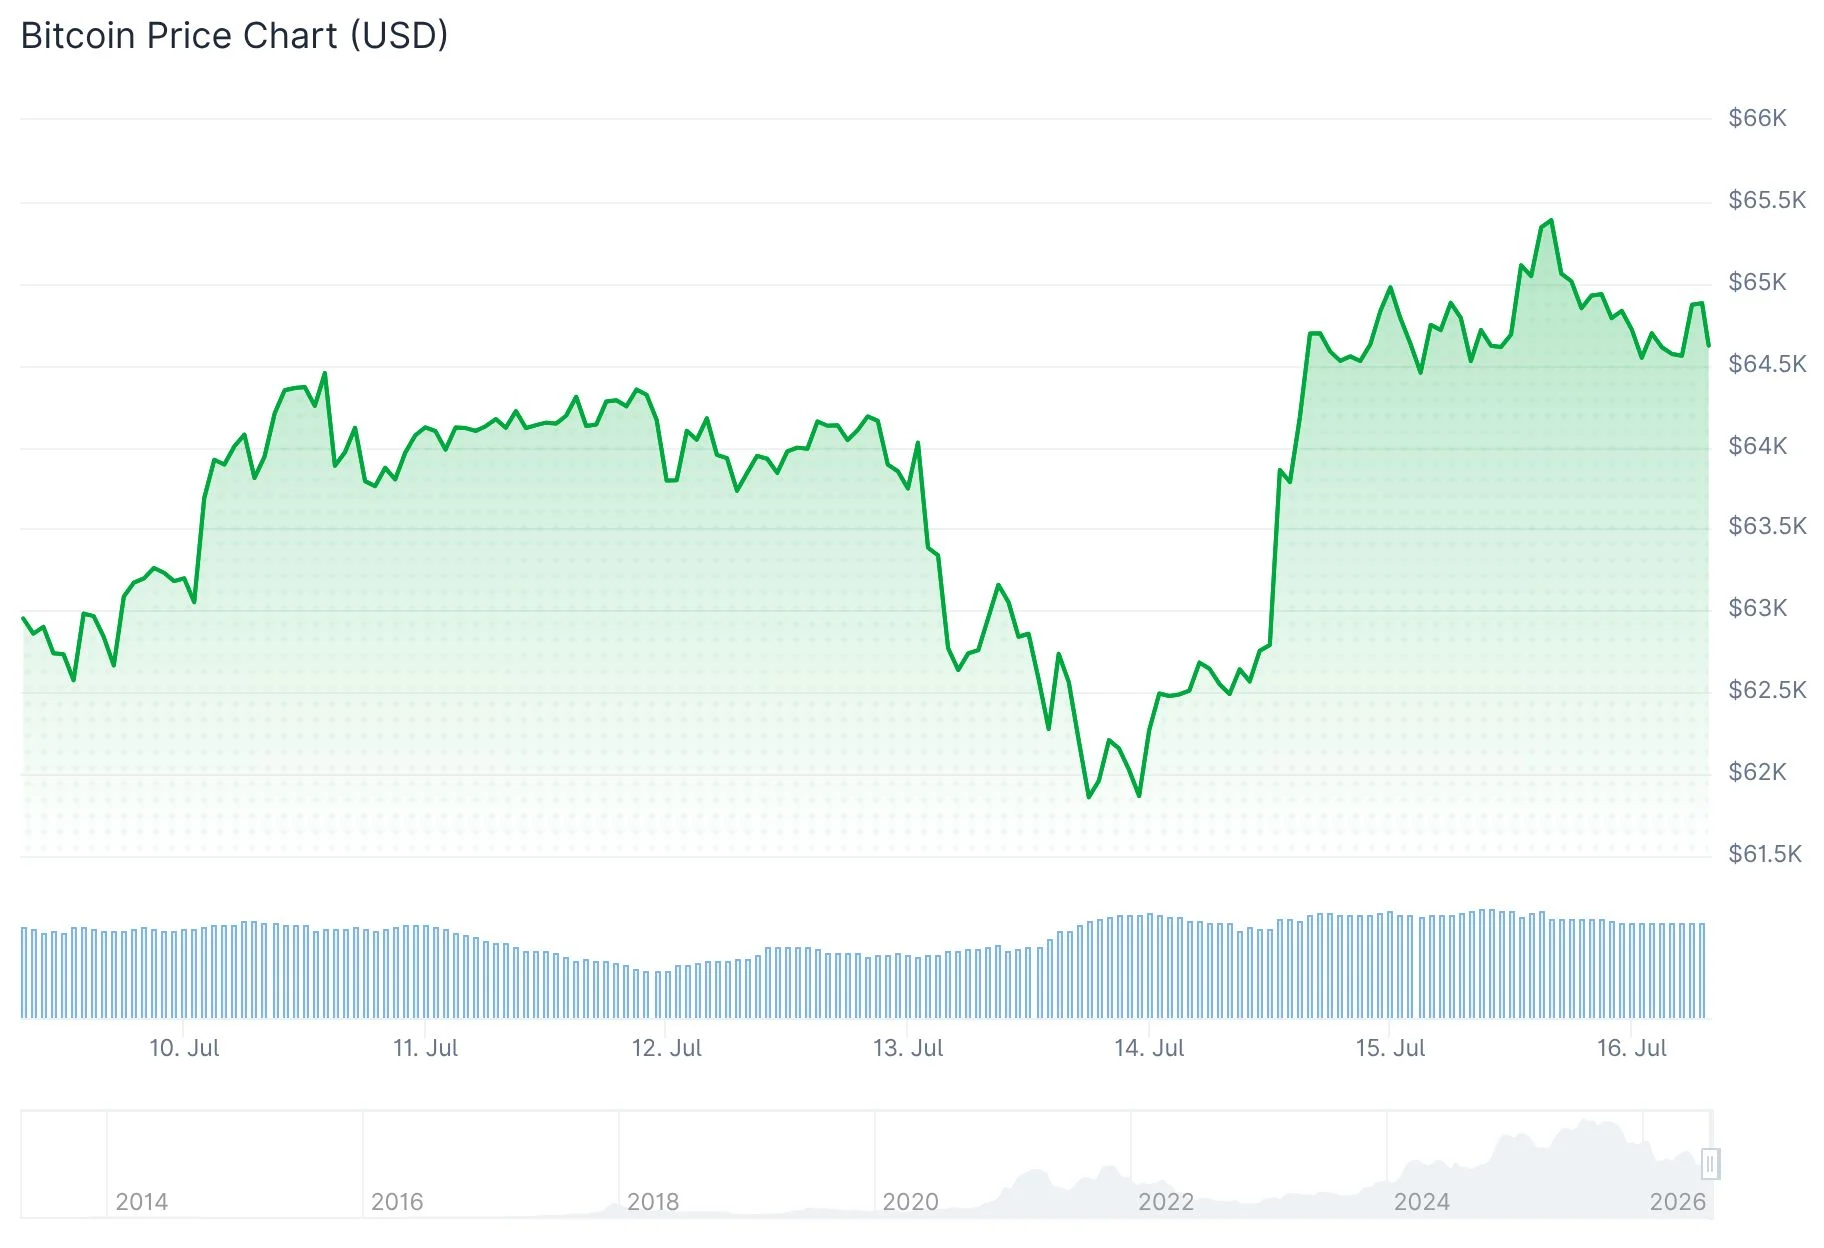
The BTC/USD pair touched $65,500 on July 15, marking its strongest performance since late June, based on TradingView market data.
The rally followed June’s Producer Price Index data showing 5.5% annual growth alongside a 0.3% monthly contraction. The Bureau of Labor Statistics attributed the decline primarily to a 1.4% decrease in goods pricing.
This development came one day after the Consumer Price Index release, which similarly undershot expectations despite upward inflationary pressure from elevated oil prices tied to intensifying U.S.-Iran tensions.
Economist Mohamed El-Erian weighed in on the PPI data, characterizing it as “much better-than-expected” and suggesting it would “boost equities and further temper market expectations for upcoming interest rate hikes.” His assessment captured a broader market pivot toward risk-on positioning.

Market analysis platform The Kobeissi Letter observed that “inflation expectations continue to decline,” referencing diminishing probability of Fed tightening on prediction markets like Polymarket.
Data from CME Group’s FedWatch Tool supported this narrative, indicating that a 0.25% rate adjustment at September’s FOMC gathering is no longer considered the leading scenario.
Critical Resistance Zones Under Scrutiny
Trader Daan Crypto Trades identified $65,600 and $67,200 as important liquidity zones above current trading levels. In an X platform update, he indicated that clearing $67,200 “would turn this into a bigger move” and position Bitcoin for a push into the $70,000+ territory. He additionally observed that BTC is approaching its Bull Market Support Band, currently situated near $70,000, with a confirmed weekly breakout and retest potentially confirming a major cycle bottom.
Market analyst Rekt Capital pointed out that BTC is nearing its 50-month exponential moving average, a technical threshold that has historically produced price rejection during bearish market phases.
BTC Consolidates on July 16
By July 16, Bitcoin had retreated slightly to $64,830, registering a 0.2% daily decline while maintaining approximately 1.6% weekly gains.
Ongoing U.S.-Iran hostilities continued dampening market sentiment, with the nations engaged in their fifth straight day of military exchanges. Concerns about potential disruptions to crude oil shipments through the Strait of Hormuz maintained elevated energy prices and sparked caution about possible inflation reacceleration in coming months.
A downturn in semiconductor sector equities further pressured overall risk sentiment on Thursday.
Bitcoin was trading with approximately 1.6% weekly gains as of July 16.
Get 3 Free Stock Ebooks
Discover top-performing stocks in AI, Crypto, and Technology with expert analysis.
- Top 10 AI Stocks - Leading AI companies
- Top 10 Crypto Stocks - Blockchain leaders
- Top 10 Tech Stocks - Tech giants


