



Key Takeaways
- BTC finished above its 50-week moving average for the first time in nearly a year, settling the week around $81,159.
- Historical analysis by Galaxy Research indicates that 11 out of 13 prior successful reclaims of this technical level were not succeeded by fresh cycle lows.
- The leading cryptocurrency has rallied approximately 29% over the last 35 days and posted its strongest weekly closing price in four months.
- Market observers are closely monitoring whether BTC can sustain its position above the moving average, which currently sits near $78,000.
- Prominent trader Ted indicated that a decisive move above $83,000 would validate the cycle bottom and presented a forecast for BTC’s trajectory over the coming two to three years.
Bitcoin has achieved a significant technical milestone by closing above its 50-week moving average for the first time in 45 weeks, bringing renewed attention to this important long-term price benchmark.
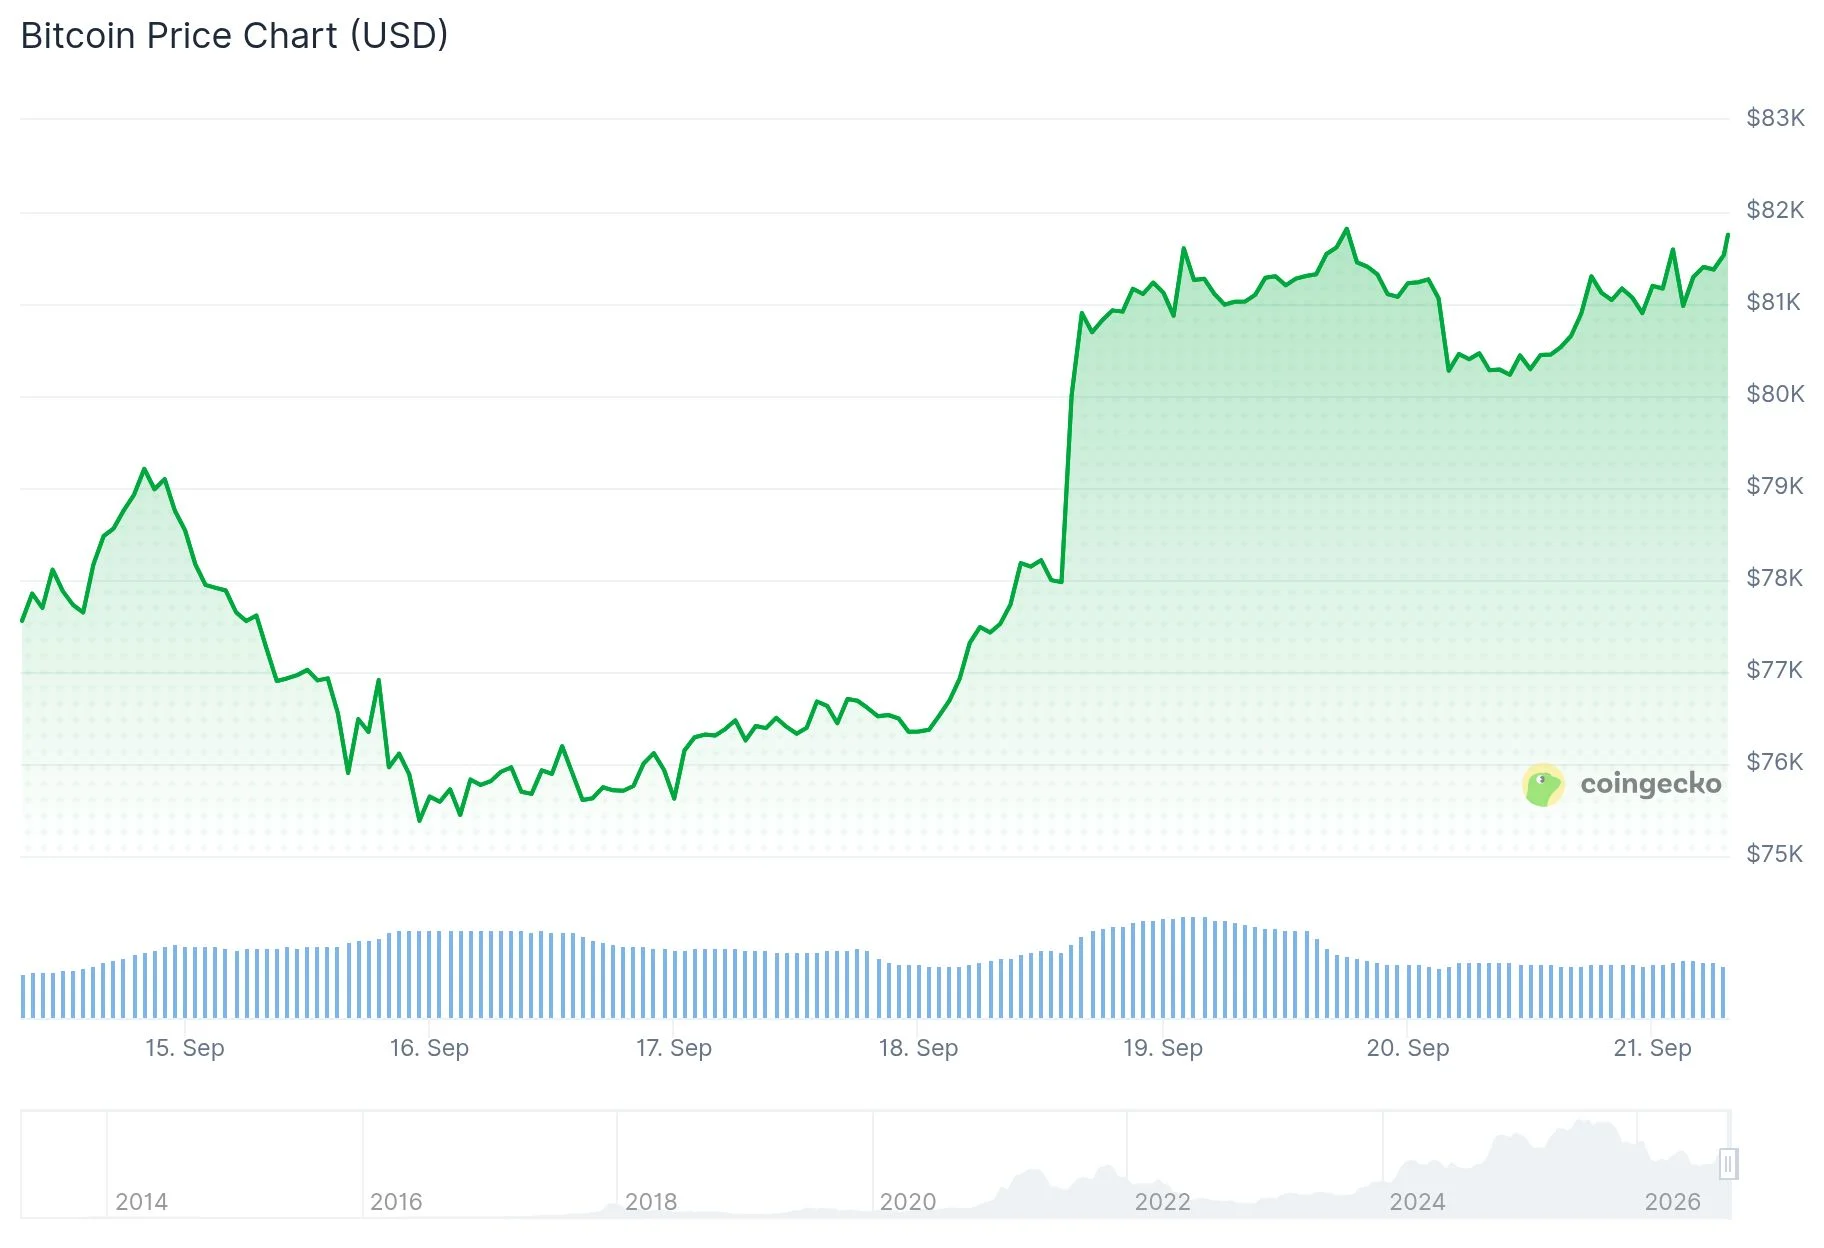
BTC concluded Sunday’s trading session at approximately $81,159 on Coinbase, positioning itself above the 50-week moving average situated near $78,788. This marked Bitcoin’s strongest weekly close in the past four months.
The digital asset posted gains of nearly 6% throughout the week. Over the preceding 35 days, Bitcoin has climbed roughly 29%.
Rather than just momentarily piercing resistance, Bitcoin’s weekly candle confirmed a close above the moving average. Technical analysts frequently rely on weekly closes to evaluate longer-term market trends.
Historical Significance of Bitcoin’s 50-Week Moving Average
The 50-week moving average represents Bitcoin’s average weekly closing price over approximately one year. Throughout previous bear markets, this metric has frequently served as a formidable resistance level.

Alex Thorn, head of Galaxy Research, has previously characterized this indicator as a price ceiling that Bitcoin has found challenging to overcome during prolonged downtrends.
Galaxy’s analysis examined 13 instances when Bitcoin reclaimed the 50-week average. In 11 of those cases, BTC avoided setting a new cycle low afterward.
Past successful breakouts above this level occurred in January 2012, October 2015, May 2019, and March 2023. Each instance followed substantial Bitcoin price declines.
The March 2023 breakthrough came after Bitcoin bottomed near $15,500 in 2022. BTC subsequently climbed to a record high near $126,000 in October 2025.
However, the indicator hasn’t been foolproof. Reclaims in December 2021 and March 2022 were ultimately followed by additional downside, with Bitcoin eventually declining toward $16,000.
Bitget’s chief analyst Ryan Lee stated that this latest weekly close bolsters the argument that Bitcoin’s recovery phase has begun. Nevertheless, he emphasized that additional weekly closes and consecutive higher lows would offer stronger validation.
Market Analysts Target $83,000 as Critical Bitcoin Resistance
Multiple market participants are now shifting their attention to $83,000 beyond just the moving average.
Cryptocurrency trader Craig Cobb noted that a decisive break above $83,000 would eliminate the lower high formation on Bitcoin’s monthly chart, indicating the longer-term downtrend would be invalidated.
Cobb is additionally tracking Bitcoin’s three-month candle formation. He explained that the historical red-to-green quarterly pattern he analyzes has resulted in a new all-time high in 11 out of 11 previously confirmed occurrences.
Analyst Ted echoed a comparable price target on X. Ted suggested that a Bitcoin surge past $83,000 would confirm the market cycle bottom, subsequently outlining his expected price trajectory for BTC spanning the next two to three years.
Bitcoin was trading in the $81,450–$81,700 range, maintaining its position above the 50-week moving average while remaining under the $83,000 threshold that multiple traders are monitoring closely.
Get 3 Free Stock Ebooks
Discover top-performing stocks in AI, Crypto, and Technology with expert analysis.
- Top 10 AI Stocks - Leading AI companies
- Top 10 Crypto Stocks - Blockchain leaders
- Top 10 Tech Stocks - Tech giants


