



TLDR
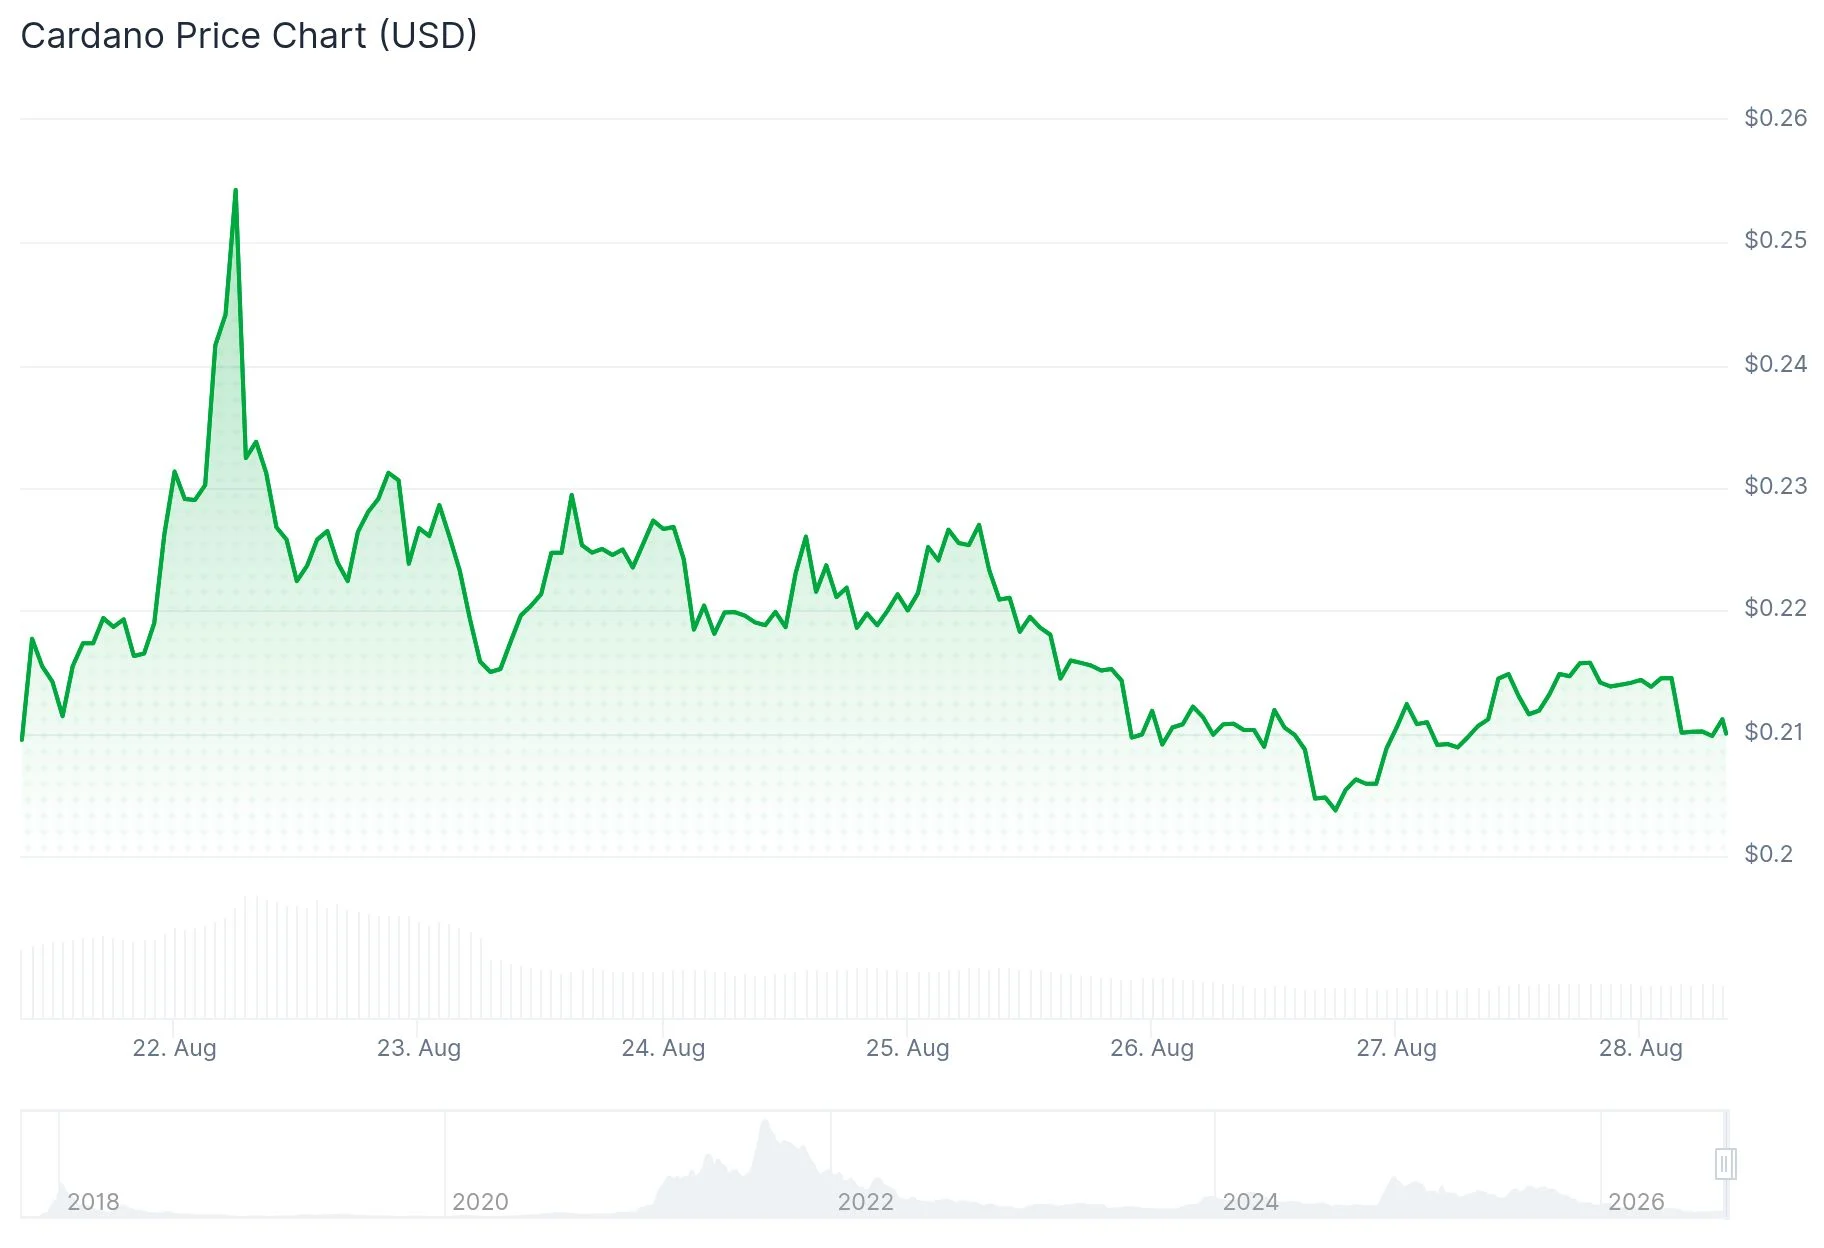
- Cardano’s price tumbled more than 7% over the week, hovering around $0.210 by Friday’s trading session
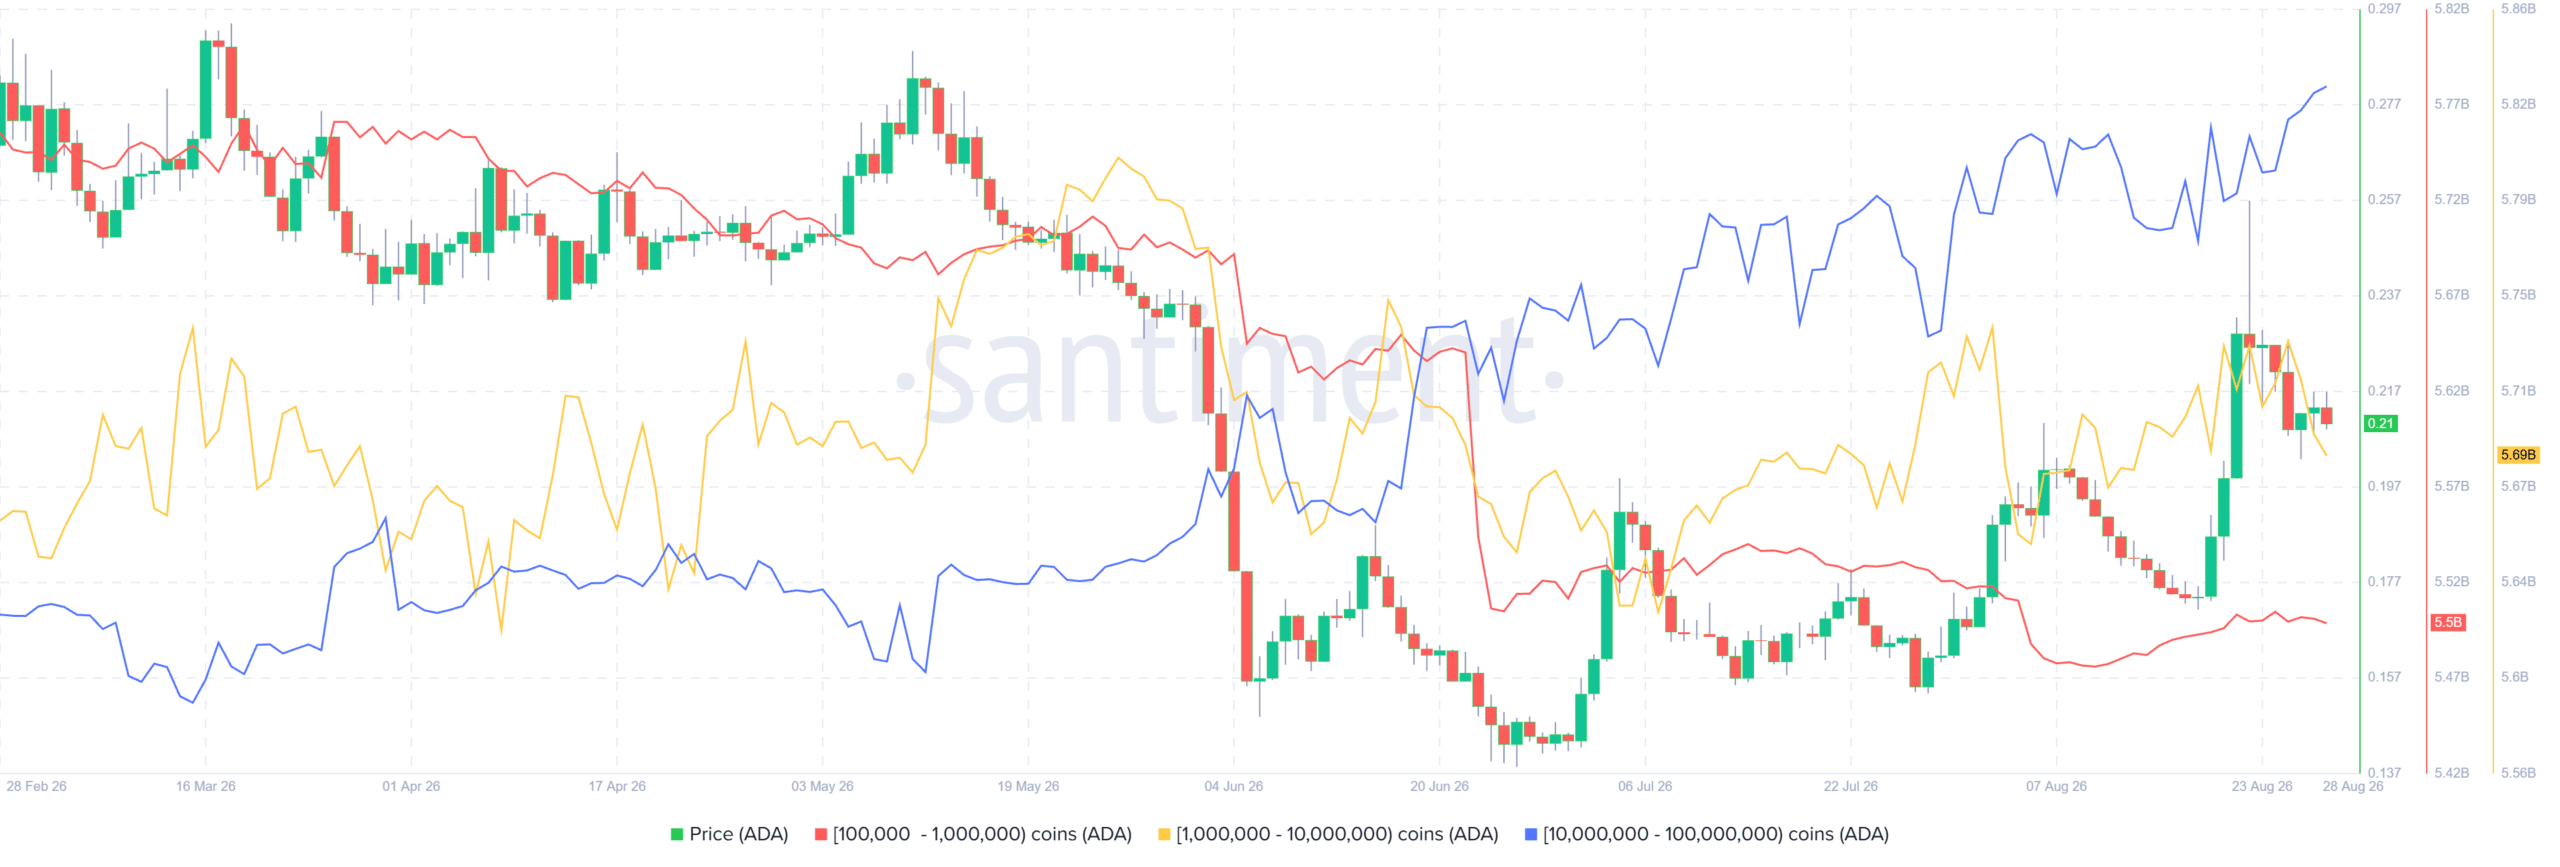
- Large holder wallets added 160 million ADA tokens to their positions throughout the recent pullback
- Trader sentiment remains bearish with a long-to-short ratio registering 0.74
- The Leios testnet demonstrated throughput capabilities six times greater than current mainnet performance across a 41-day trial period
- Conflicting blockchain data and derivatives indicators create an ambiguous short-term price trajectory
Cardano (ADA) is currently changing hands near the $0.210 mark on Friday following a weekly decline exceeding 7%. This downward movement has sent ADA beneath the $0.220 threshold, capturing the focus of market participants and blockchain analytics experts alike.
While price action shows weakness, major holders have actively purchased during the downturn. According to Santiment’s tracking, addresses controlling between 10 million and 100 million ADA added 160 million tokens to their holdings starting Sunday. This demonstrates sustained conviction from institutional-sized investors, despite failing to halt the near-term downward pressure.
Futures market indicators present contradictory signals. CoinGlass reports ADA’s long-to-short ratio currently stands at 0.74, approaching its monthly low. When this metric falls below unity, it indicates traders are predominantly positioned for additional downside.
Conversely, funding rates shifted into positive territory Thursday, registering 0.0013% as of Friday. This development means long position holders are compensating short sellers, suggesting some bullish conviction exists within leveraged markets.
CryptoQuant’s analysis reinforces the uncertainty. While substantial whale-sized orders appear in futures markets, selling activity currently outweighs buying. Additional indicators remain in neutral territory.

Critical Price Zones Under Observation
ADA has successfully recaptured its 50-day and 100-day exponential moving averages, positioned at $0.190 and $0.197 respectively. This achievement provides modest bullish structure for the immediate term, though upward progress faces headwinds from resistance levels above.
The Relative Strength Index is declining toward the upper-50s while the MACD histogram shows compression. These technical signals indicate weakening bullish momentum. Immediate resistance barriers appear at $0.213, $0.231, and $0.236. The 200-day EMA at $0.246 marks the primary overhead resistance zone.
For downside scenarios, initial support emerges near $0.195, followed by $0.173. A decisive breach below this support cluster might activate a move toward $0.150.
Market analyst Sssebi shared on X that a weekly candle close above critical resistance would confirm a substantial upward movement. The analyst emphasized that weekly timeframe confirmation serves as the catalyst for the subsequent rally phase.
Leios Testnet Demonstrates Impressive Performance
Beyond market dynamics, Cardano’s technical development team released compelling data from the inaugural public Leios testnet trial. The experimental network achieved throughput levels six times higher than current mainnet capacity throughout the 41-day testing window. During peak stability, Leios managed 54% of total network activity, executing 18 times the transaction volume of actual mainnet traffic and processing 3.3 times the data volume.
All identified challenges during testing originated from implementation code rather than fundamental protocol design. The development team addressed these obstacles through weekly public software updates.
Leios functions as an additional layer built atop Cardano’s established Ouroboros Praos consensus mechanism. It introduces endorser blocks positioned between Praos blocks, enabling concurrent transaction processing. The subsequent testing phase, designated Water, has already commenced and incorporates an incentive structure for stake pool operators.
Get 3 Free Stock Ebooks
Discover top-performing stocks in AI, Crypto, and Technology with expert analysis.
- Top 10 AI Stocks - Leading AI companies
- Top 10 Crypto Stocks - Blockchain leaders
- Top 10 Tech Stocks - Tech giants


