
 Hovers Near Critical Fibonacci Resistance at $0.11799")
Key Takeaways
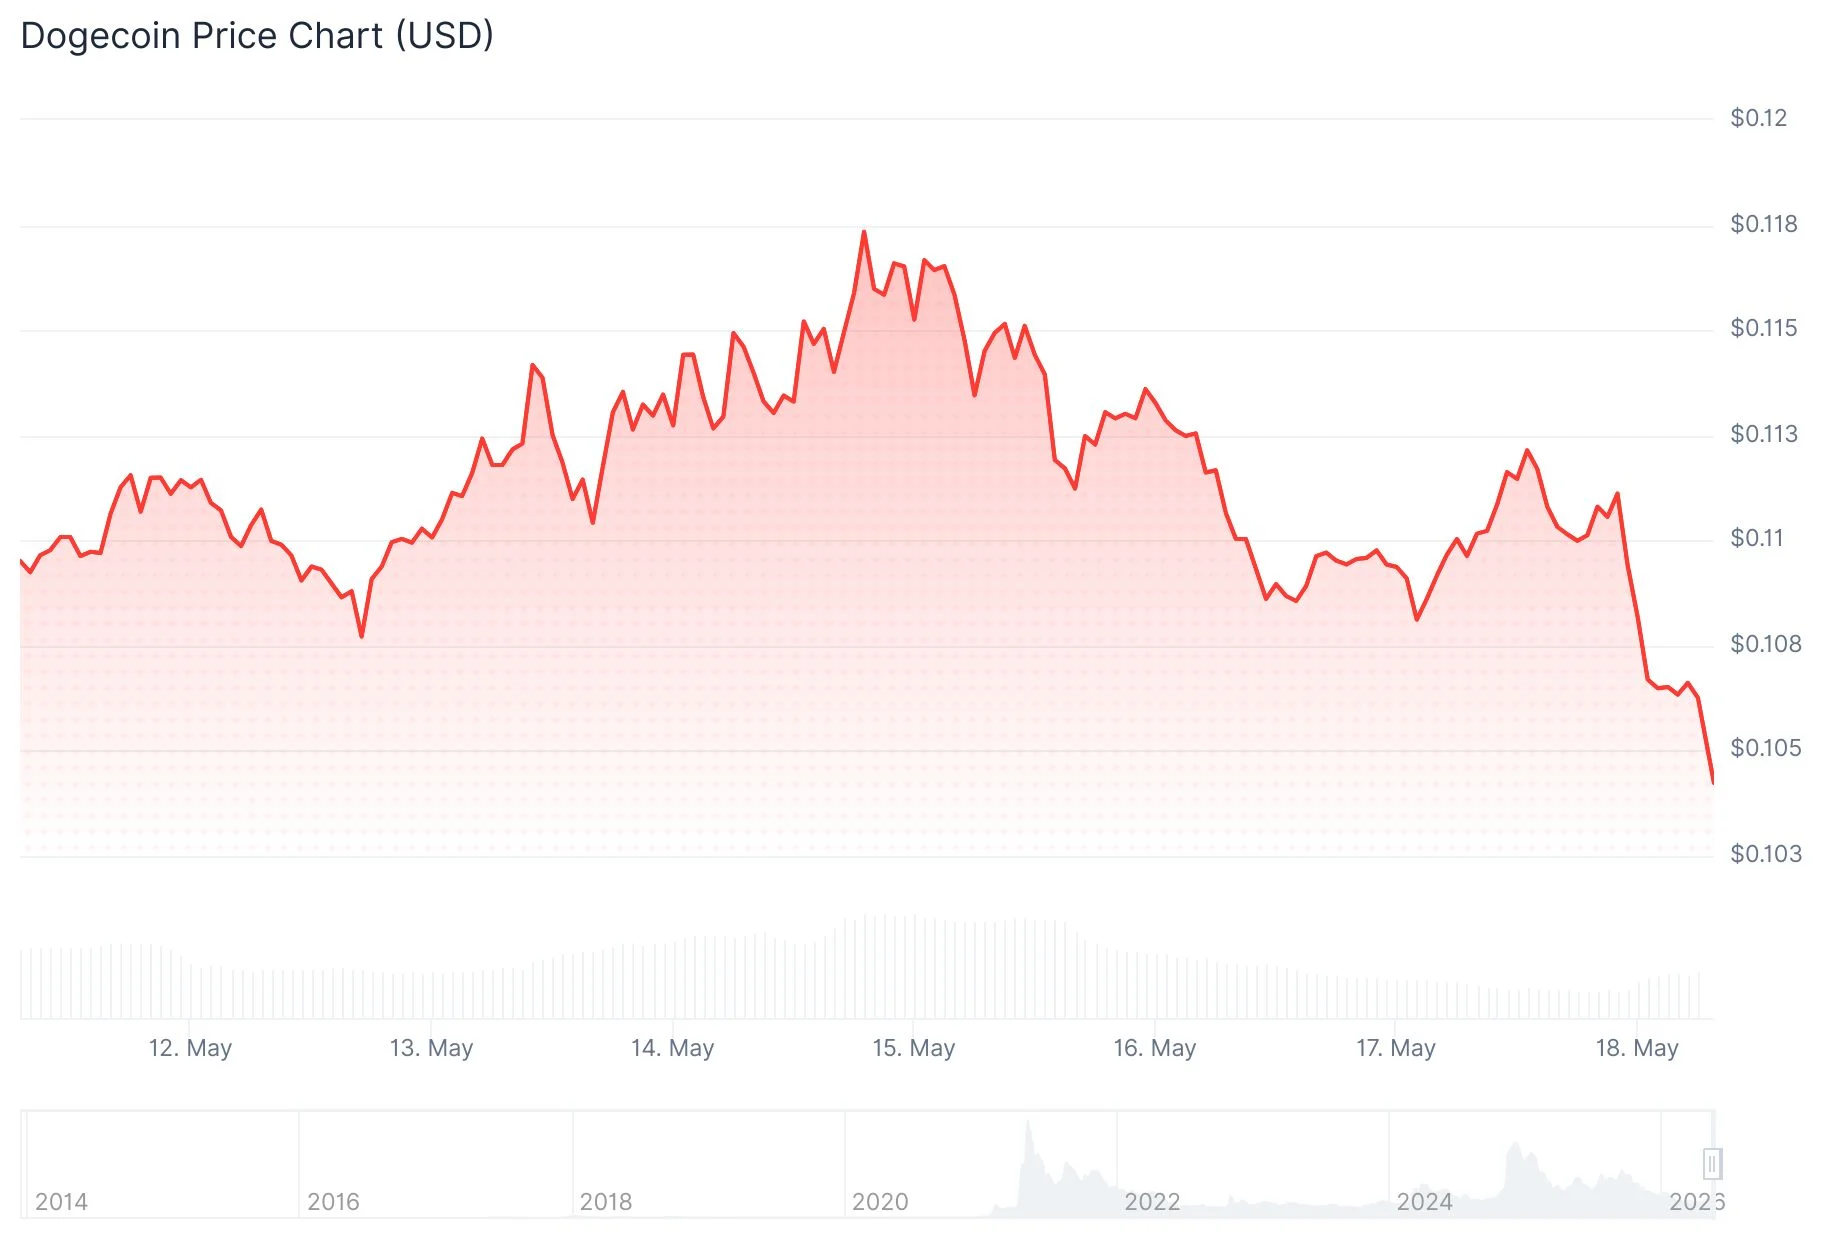
- DOGE currently trades between $0.1102–$0.1105 with an $18.73 billion market capitalization
- The meme coin faces a critical test at the 0.618 Fibonacci resistance zone of $0.11799
- Technical analyst BitGuru identifies potential upside movement toward the $0.13–$0.15 range with sufficient momentum
- Derivatives metrics reveal declining open interest and trading volume, though funding rates maintain a positive bias
- Market observer Cryptollica draws parallels between current price structure and historical cycle lows from 2015, 2020, and 2022
As of May 17, 2026, Dogecoin maintains a price position around $0.1105, registering a modest 1.23% increase over the past 24 hours. The popular meme cryptocurrency shows $1.29 billion in daily exchange volume alongside its $18.73 billion valuation.
Recent trading sessions have seen the asset enter a lateral movement pattern. Neither bulls nor bears have established clear directional control, though this consolidation phase has captured significant analytical interest.
Cryptocurrency market analyst BitGuru shared observations via X on May 17, highlighting that DOGE experienced a liquidity sweep before entering its current sideways trading pattern. According to his assessment, sustained momentum development could propel pricing into the $0.13–$0.15 corridor. BitGuru emphasized his focus on identifying confirmation signals for a potential breakout scenario.
Examining the weekly timeframe reveals DOGE’s recent rebound from the 0.786 Fibonacci support zone positioned near $0.08042. Following this bounce, the cryptocurrency has advanced toward the 0.618 Fibonacci resistance barrier at $0.11799, which now represents the most significant technical hurdle.
Market commentator Surf characterized the pullback as structurally sound, suggesting the $0.10 zone should provide reliable support. His analysis draws comparisons to 2024 chart patterns, when DOGE recovered from comparable levels before initiating a more substantial upward trajectory.

Critical Price Zones Under Observation
A weekly candle closure above the $0.11799 threshold would generate bullish technical signals. Should this breakthrough materialize, subsequent resistance barriers emerge around $0.14 and $0.17 according to current Fibonacci projections.
Conversely, failure to overcome this resistance level would shift focus to the $0.095–$0.10 support corridor as the essential zone for maintaining price stability.
Historical Cycle Analysis
Analyst Cryptollica presented a macro perspective, drawing correlations between today’s price behavior and previous cyclical bottoms. His framework categorizes past market sentiment phases as “disbelief” during 2015, “boredom” throughout 2020, and “anger” in 2022. The current environment represents another sentiment recalibration period, characterized by diminished market attention and momentum ahead of potential larger price movements.
This historical framework doesn’t forecast an imminent breakout. Rather, it provides perspective on DOGE‘s position within extended market cycles.
Derivatives market data reveals open interest contracted by 0.79% to reach $1.52 billion during the previous 24-hour period. Trading volume experienced a sharper decline of 39.17%, settling at $1.62 billion—indicating reduced active participation from leveraged traders.
Funding rates maintained a slightly positive reading of 0.0006%, suggesting a modest contingent of traders maintains near-term bullish positioning.
DOGE has not yet validated a breakout scenario. The 0.618 Fibonacci resistance positioned at $0.11799 stands as the next decisive test for price trajectory.
Get 3 Free Stock Ebooks
Discover top-performing stocks in AI, Crypto, and Technology with expert analysis.
- Top 10 AI Stocks - Leading AI companies
- Top 10 Crypto Stocks - Blockchain leaders
- Top 10 Tech Stocks - Tech giants

