


Key Highlights
- Dogecoin has gained 2.25% today, reaching $0.073 following US CPI data revealing inflation fell to 3.5%
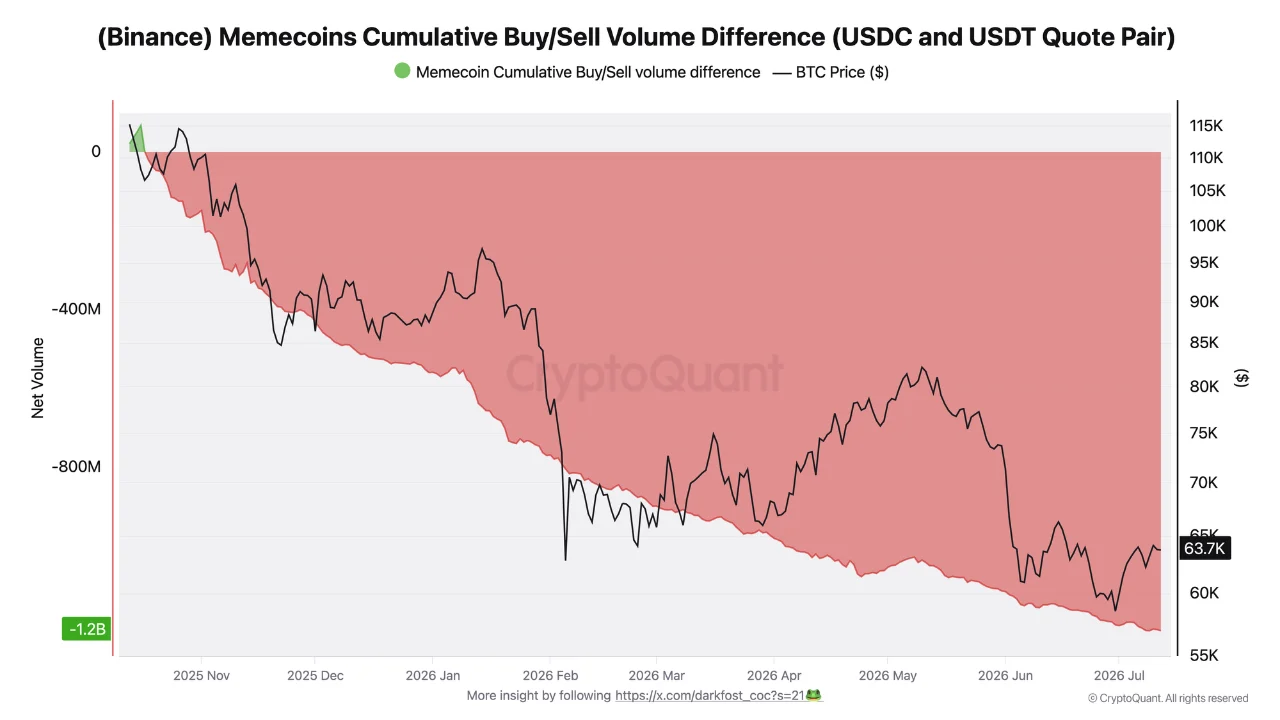
- A massive $1.2 billion meme coin liquidation has occurred on Binance since October 2025
- The meme coin has plummeted 73% from its October 2025 peak of $0.26
- No capital has flowed into Dogecoin ETF products since June 17, with total net assets at only $9.9M
- Critical support level established at $0.071; breakdown could trigger decline to $0.068–$0.064 range
Dogecoin has climbed to $0.073 as of July 14, marking a 2.25% intraday increase. This upward movement followed the release of US inflation figures indicating the Consumer Price Index declined to 3.5%, providing temporary support for risk-oriented assets.
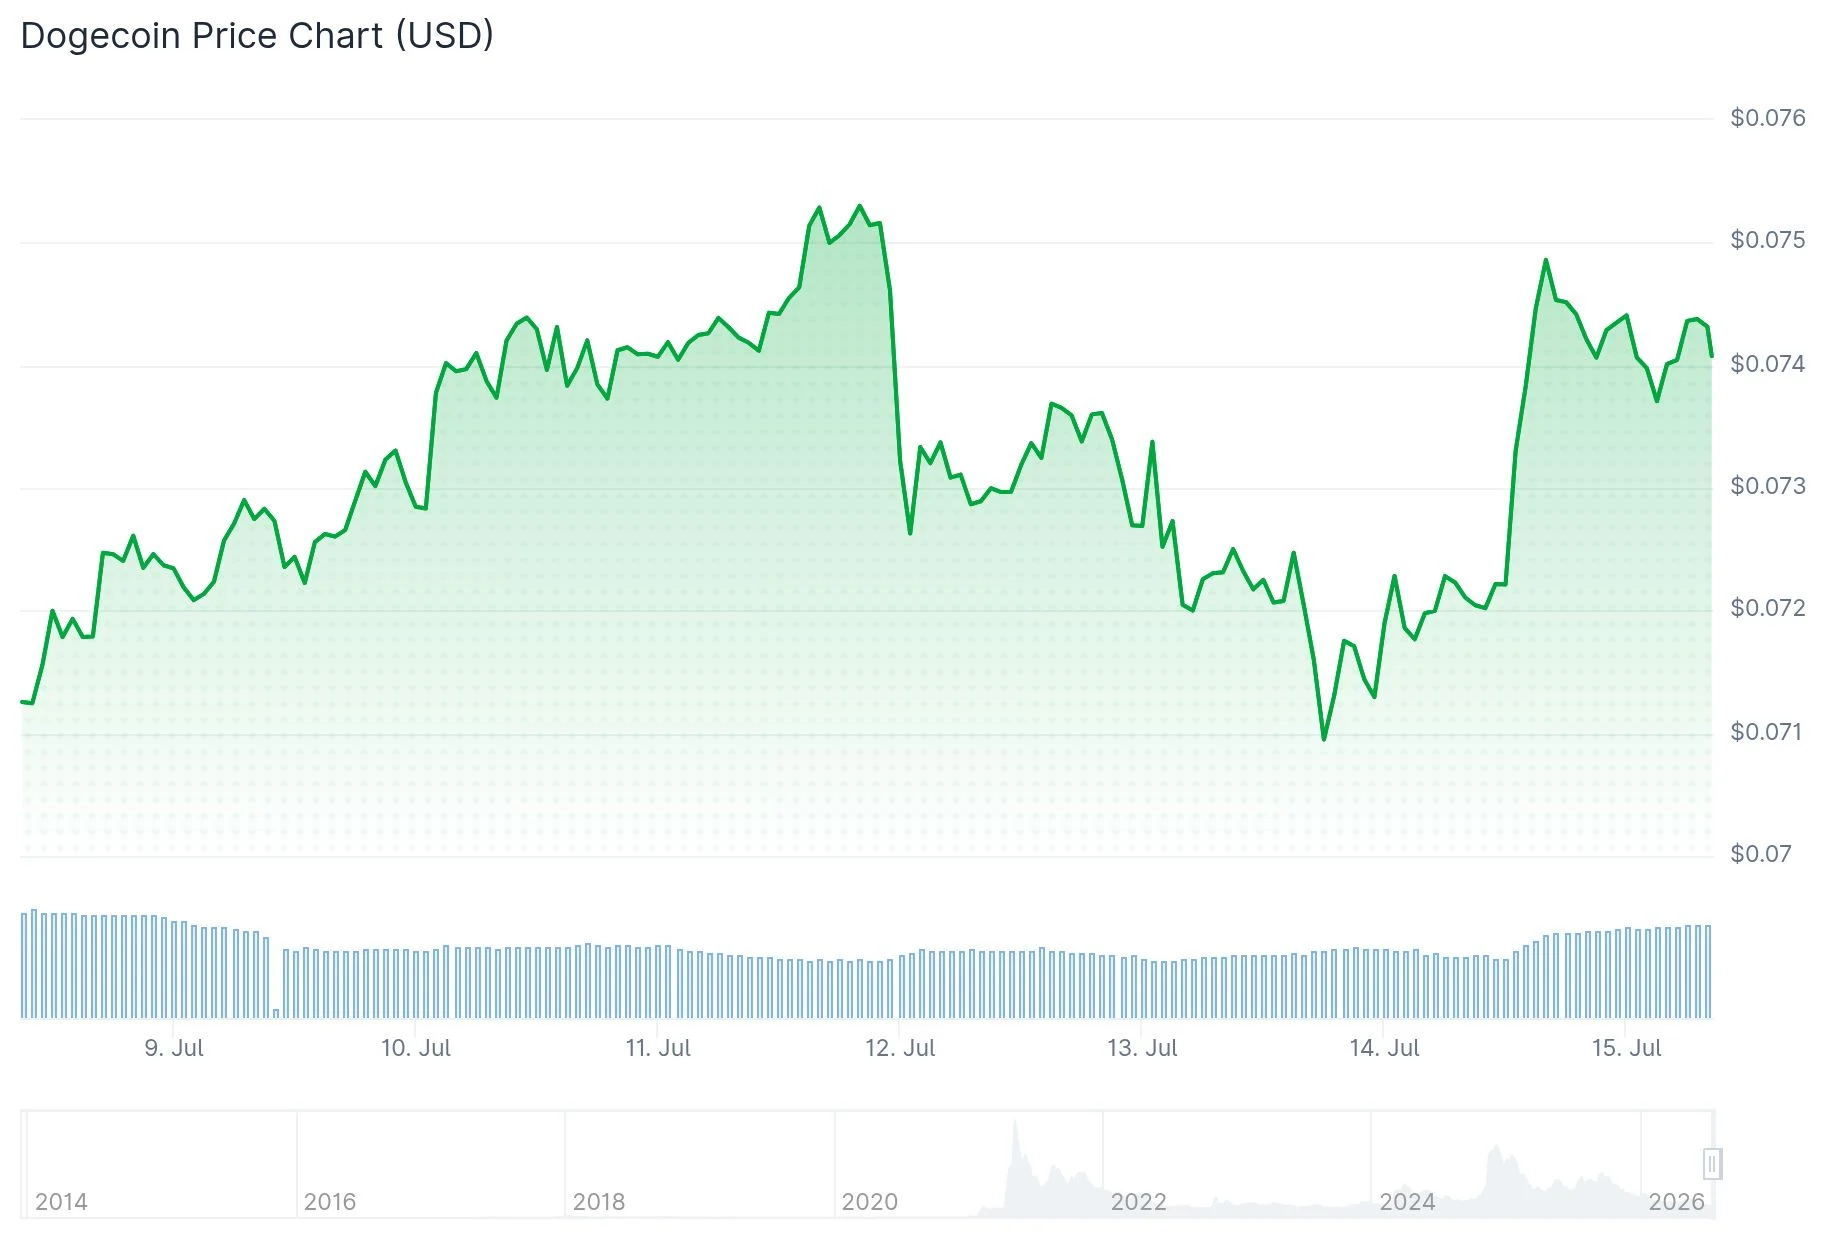
While the token has posted modest daily gains, the broader trajectory for DOGE shows considerable weakness. The cryptocurrency has experienced a devastating 73% decline since October 2025, when it commanded a price near $0.26. During the identical timeframe, Bitcoin declined approximately 50%, highlighting DOGE’s substantial underperformance relative to the leading digital asset.
According to intelligence from CryptoQuant, Binance users have liquidated $1.2 billion in meme coin holdings since October 2025. Market analyst Darkfost characterizes meme tokens as the “highest-risk category” within cryptocurrency markets, cautioning that the current price uptick may prove unsustainable without a meaningful resurgence of buyer activity.
Market observer Kamran Asghar highlighted on X that $DOGE is maintaining a critical weekly accumulation region around $0.07, where historical cycle lows have established themselves, potentially setting the stage for a broader recovery trajectory toward elevated price objectives.
Charts Signal Continued Bearish Pressure
Dogecoin currently trades beneath its 200-day, 100-day, and 50-day exponential moving averages. The Relative Strength Index registers at 41, maintaining bearish positioning despite recent upward movement. An RSI break above 50 could catalyze momentum shifts and propel pricing toward the 50-day EMA positioned at $0.082.

Examining the daily timeframe, DOGE has violated the $0.0715 support threshold following an unsuccessful rebound attempt near $0.078. Should the price settle below $0.0715, market technicians are monitoring $0.068 and the $0.064–$0.066 corridor as subsequent downside objectives.
A prospective bullish double-bottom formation is materializing on the daily chart provided DOGE maintains the $0.071 support floor. If this pattern completes, the initial target sits at the July 4 peak of $0.079, with potential for a 10% extension to $0.087 thereafter.
Market analyst Trader Tardigrade references the monthly timeframe, suggesting the 2021–2026 formation replicates the 2014–2017 cycle that preceded Dogecoin’s substantial 2017–2021 bull run. The chart displays a descending wedge structure that could indicate a prolonged reversal scenario if DOGE achieves a breakout and sustains momentum.
Exchange-Traded Products and Derivatives Activity Decline
Dogecoin exchange-traded funds have registered zero capital inflows since June 17. These investment vehicles have experienced no flow activity for six straight trading days beginning July 2 and maintain merely $9.9 million in combined net assets — representing 0.09% of DOGE’s aggregate market capitalization.
Derivatives open interest has contracted from $1.76 billion in May 2026 to $1 billion as of July 14. The long-to-short position ratio has decreased to 0.88 according to CoinGlass analytics, indicating more market participants are betting on additional price deterioration rather than appreciation.
The July 1 introduction of Robinhood Chain has generated renewed attention for select meme tokens, with its native token CASHCAT achieving a $138 million market capitalization since deployment.
Get 3 Free Stock Ebooks
Discover top-performing stocks in AI, Crypto, and Technology with expert analysis.
- Top 10 AI Stocks - Leading AI companies
- Top 10 Crypto Stocks - Blockchain leaders
- Top 10 Tech Stocks - Tech giants


