



Key Highlights
- Current DOGE price hovers at $0.0848 within an upward-sloping channel pattern, with market watchers eyeing $0.093 resistance
- Futures market activity surged 65% to reach $1.17 billion in volume, as open interest stands at $1.26 billion
- Large holders purchased more than 240 million DOGE tokens throughout the latest pullback, per Ali Charts data
- Technical indicator TD Sequential flashed a buy signal at the $0.0839 level, historically followed by rallies reaching 11.25%
- Upcoming CLARITY Act decision and this week’s Federal Reserve meeting may introduce near-term price swings for DOGE
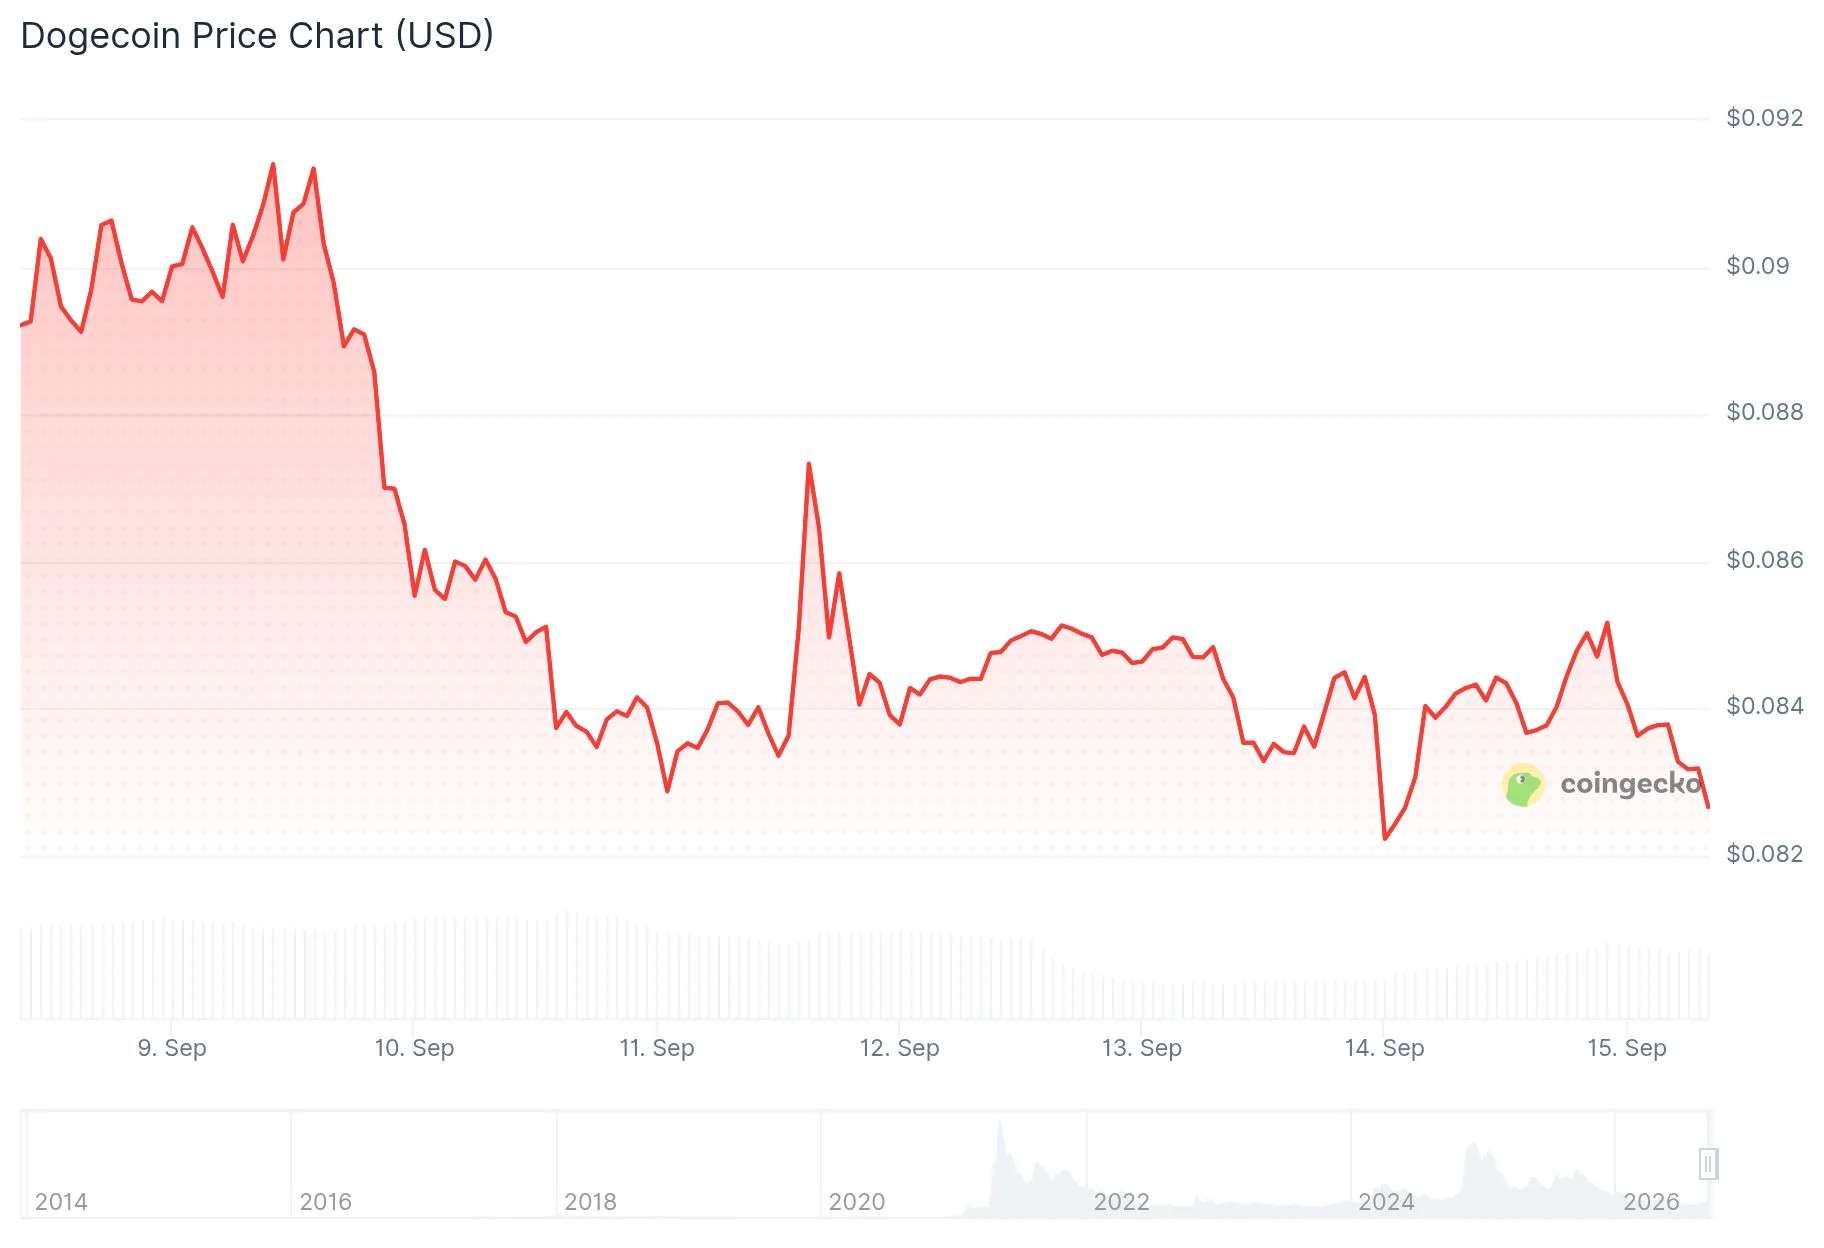
The popular meme cryptocurrency Dogecoin is currently changing hands near $0.0848 following a successful defense of crucial support between $0.080 and $0.082. Price action has rebounded from the channel’s lower boundary on two separate occasions, with technical analysts identifying $0.093 as the upcoming resistance threshold.
The cryptocurrency sector as a whole climbed 1.32%, pushing aggregate market capitalization to $2.65 trillion. During this timeframe, Bitcoin hovered around $78,905, Ethereum maintained levels near $2,532, and XRP traded at approximately $1.44.
Market analyst Ali Charts identified a new TD Sequential buy indication on DOGE’s four-hour timeframe at roughly $0.0839. This technical tool has previously generated price recoveries of 6.96%, 2.71%, and 11.25% in prior occurrences, prompting market participants to monitor the present configuration attentively.
Data from Ali Charts reveals that major holders have acquired upwards of 240 million DOGE throughout the previous seven-day period, capitalizing on the pullback to secure positions at reduced price points. This accumulation pattern indicates that substantial investors are establishing exposure in anticipation of a possible upward movement.
Activity in Dogecoin’s futures marketplace experienced notable expansion. Contract trading volume climbed 65.06% to register $1.17 billion. Total open interest recorded $1.26 billion, representing a minor 1.63% decline, suggesting heightened trading activity without corresponding growth in fresh leveraged exposure.

Chart Analysis
Examining the four-hour timeframe, the MACD histogram has turned marginally bullish at 0.00018, indicating weakening downside pressure. The Chaikin Money Flow indicator advanced to 0.01, providing modest confirmation of accumulation activity.
The Relative Strength Index currently registers near 44, positioned beneath the neutral 50 threshold yet maintaining distance from oversold conditions. While the MACD line continues tracking beneath its signal line, the negative histogram displays signs of compression.
Market commentator CRG highlighted DOGE’s positioning above multiple exponential moving averages on the daily chart as evidence of a potential long-term base formation. Sustained trading above this EMA confluence maintains the constructive technical framework.
Critical Price Zones
A decisive four-hour candle closure beyond $0.09 would establish a pathway toward $0.095, with further upside potentially extending to the August high around $0.10. Breaking through $0.10 brings $0.113–$0.114 into focus as the subsequent major barrier, with $0.176 representing longer-term resistance.
Should DOGE surrender support at $0.079, downside attention shifts to $0.075 followed by $0.070.
Market participants are closely monitoring Tuesday’s scheduled CLARITY Act vote alongside Wednesday’s Federal Reserve policy announcement. Either development carries potential to generate significant price movement in Dogecoin.
At press time, DOGE was quoted at $0.0847, reflecting a 0.78% gain over the trailing 24-hour period.
Get 3 Free Stock Ebooks
Discover top-performing stocks in AI, Crypto, and Technology with expert analysis.
- Top 10 AI Stocks - Leading AI companies
- Top 10 Crypto Stocks - Blockchain leaders
- Top 10 Tech Stocks - Tech giants


